The Field as Pictures
The logarithms, the inverses and the plane of GF(257) set out as pictures, each one singly, with what it is, how it was made and what is counted in it.
Wallet: bc1qtphsftylaj9s0wvapvs50ltsl5saalny4dhyv9
How to read themWhat is shown, and by what routines
A table of the field is a list of numbers, and a list of numbers set out in rows is a picture. The line, GF(257), has 256 cells besides the seed; sixteen to a row they fill a square of 16 × 16. The plane over it, GF(257²), has 257 × 257 points a + bφ; each stands at column a, row b. Row 0 is at the top. Black is 0 and white is 255.
The routines are those of a printed text on signal processing in C, its chapter on pictures, followed as its listings are printed: Listing 7.5 counts a histogram, 7.6 flattens it, 7.7 is the convolution, 7.10 finds edges by three convolutions, 7.11 and 7.12 are the median. They work in whole numbers and divide as C does, toward 0.
A kernel of 3 × 3 cannot be laid on the outermost ring of a picture. The text's routine leaves that ring as its memory was given out, set to zero: a black frame one element wide, the dead band. The edge routine blurs first and then looks for steps, and the blur's own black frame is a step, so just inside the dead band the gradients are high all the way round. That bright frame is the listing's and not the table's.
The edge routine asks the reader for its threshold. These pictures take twice the average gradient, a choice made for these pages.
Under each picture is what it is, how it was made and what is counted in it, and at the end of each note which of its statements follow from the arithmetic, and so could not have come out otherwise, and which were counted. Every figure is computed when the page is built; none is typed in. There are 65 pictures.
IThe logarithms, 16 × 16
The table of logarithms to the base 3, the field's generator, for the cells 0 to 255, sixteen to a row. Twelve pictures: the table, and what each listing makes of it.
The logarithm table as a picture
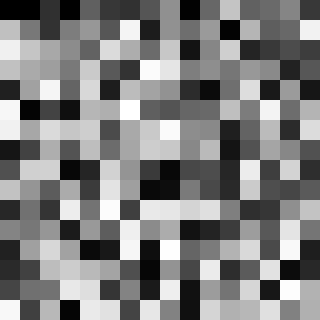
grey level = the logarithm, 0 black to 255 white
Cell p holds its logarithm, the k for which 3k ≡ p mod 257. Cell p stands at column p mod 16, row p div 16, row 0 at the top; black is 0, white 255. The seed, cell 0, has no logarithm and is written 0. Cell 1 has the logarithm 0 as well, so level 0 stands twice, side by side at the top left. Level 128 is the logarithm of 256 = −1, the one cell past the end of the picture, so it stands nowhere. Every other level stands once.
Multiplying by 16 turns the picture: the cell at column c, row r goes to column 16 − r, row c − 1, a quarter turn, for the 225 cells with c and r both from 1 to 15, and every level gains 192, the logarithm of 16. Twice is the fold, p → 257 − p, and every level gains 128. 257 = 16² + 1 is why sixteen to a row is the field's own width.
Neighbouring cells are unlike: the mean step from a cell to the one on its right is 88.8 levels, where 85.3 is the mean between two levels taken from 0 to 255 without regard to place.
From the arithmetic: that each level is taken once, 3 being a generator. Particular to the picture: that the two exceptions are 0 and 128, the logarithms of 1 and of −1.
Its histogram, Listing 7.5
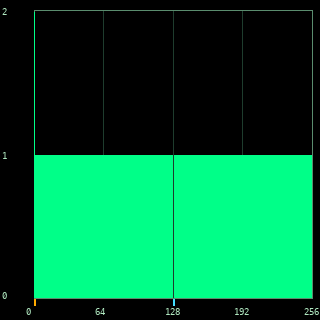
levels 0 to 255; twice 0 · none 128
Listing 7.5 counts how many elements hold each level; the levels run 0 to 255 from left to right and the height of a bar is the count. 255 levels are used. Every bar is 1 high but two: level 0 is 2 high and level 128 has no bar. The amber mark under the axis is the level held twice, the blue mark the level held by none.
A picture cannot be flatter than this and have an exception. The table is every level once, less the one logarithm that fell past the end, 128, and with the seed written in at 0.
From the arithmetic, all of it.
Flattened, Listing 7.6
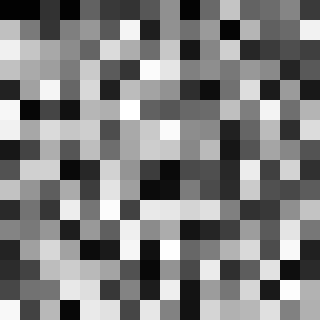
new level = whole part of 255 × sum + 0.5
Listing 7.6 adds the histogram up from level 0, in single precision, and sends level i to the whole part of 255 × sum + 0.5. A histogram is flattened by moving crowded levels apart and thin ones together.
This picture was flat before. By the listing as printed it is moved all the same: of the 256 levels 128 move, levels 0 to 126 go up by 2; level 127 goes up by 1. After it 254 levels are used, levels 2 and 128 held twice and levels 0 and 1 by none. To the eye the panel is the table again; the change is one level over part of its range.
The text beside the listing says that a picture whose histogram is flat already is left as it is. The listing as printed does not leave it. Its running sum counts the level itself, so in a picture of every level once level i is sent to the whole part of 255 (i + 1)/256 + 0.5, which is i + 1 up to level 127 and i from 128 on. Here the second element at level 0 puts the sum one further on below 128, and the level that is missing, 128, brings it back.
Counted, by the listing's own steps.
The histogram after flattening
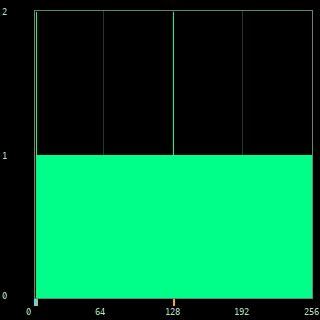
twice 2 and 128 · none 0 and 1
The same count after Listing 7.6. The amber marks are the levels now held twice, 2 and 128, and the blue marks the levels now held by none, 0 and 1. A routine meant to make a histogram flat has made a flat one a little less so.
Counted.
Blurred, Listing 7.7
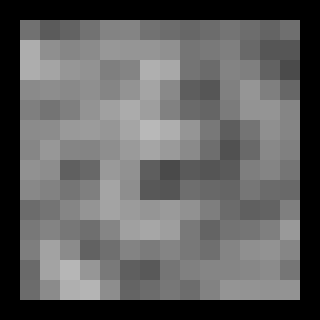
convol2d, 1 2 1 / 2 4 2 / 1 2 1 over 16
Listing 7.7, convol2d, lays the kernel 1 2 1 / 2 4 2 / 1 2 1 on every place it fits, adds the nine products, and divides by 16, the sum of the kernel's magnitudes; the quotient is cut toward 0, as C divides whole numbers.
The black frame is the dead band: the kernel does not fit on the outermost ring, and the routine leaves that ring at the 0 its memory was given out with. Inside it the levels run only from 74 to 184. The table's neighbours being unlike, their weighted mean is drawn toward the middle of the range everywhere, and the blur is nearly one grey.
Counted.
Median, 3 × 3, one pass, Listings 7.11 and 7.12
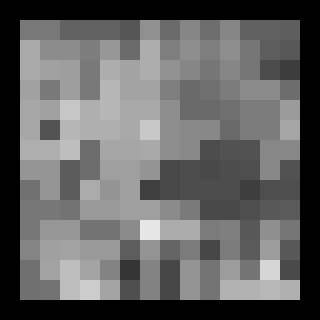
choice 3, one pass
Listing 7.11, nonlin2d, takes the nine elements about a place, sorts them, and writes the middle one; Listing 7.12 is the program about it, asking which of three filters and how many passes. Here the choice is 3, the median, and one pass.
Inside the dead band the result runs from 53 to 230 with an average of 130.2, on 101 levels in all. A median keeps what a neighbourhood agrees on and drops what stands alone; in a table where every level stands once nothing agrees, and what is left is a coarser table, each element a level that one of its nine neighbours held.
Counted.
Gradients, Listing 7.10
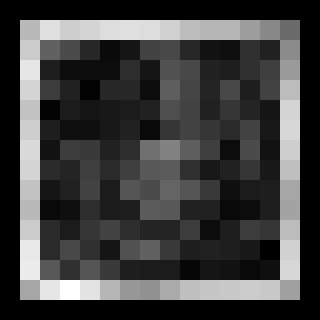
Min 0 Max 84 Avg 21.2
Listing 7.10, EDETECT, makes three passes of convol2d: the blur of the panel above, then on the blur two Sobel kernels, one for steps across and one for steps down, each sum divided by 8. At every element it keeps the larger of the two magnitudes. It reports Min = 0, Max = 84, Avg = 21.2, the average taken over all 256 elements as the listing takes it. The panel is stretched from black at Min to white at Max.
The bright frame is not the table's. The blur's dead band is 0 and the blur inside it is near the middle grey, so just inside the dead band the Sobel kernels find a step all the way round. That is the listing meeting its own frame.
Counted.
Edges over 16
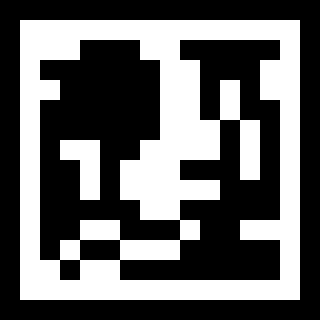
103 elements
The edge routine asks the reader for a threshold between Min and Max and writes 255 where the gradient is over it and 0 elsewhere. Over 16 stand 103 of the 256 elements.
16 is here to be held against the first sheet, which showed the edges above 128 with the Sobel sums not divided: 108 elements. The listing divides by 8, and 128 over 8 is 16. By the listing 128 itself is outside Min to Max and is refused.
Counted.
Edges over 42, twice the average
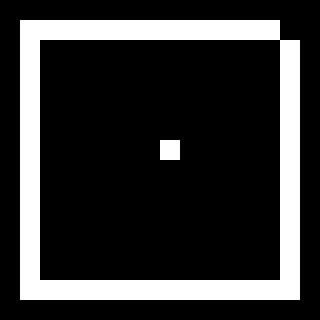
52 elements
Over 42, twice the average gradient, stand 52 elements: 51 on the frame just inside the dead band and one inside, cell 120 with a gradient of 43. The threshold is a choice made for these pages; the listing asks for it.
So by this measure the logarithm table has almost no edges of its own: what the routine finds is the frame. The first sheet's gradients, not divided, find the same elements over twice their own average, 345.
Counted.
Light and dark
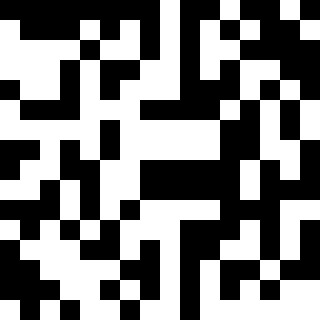
white where dlog is 128 or more
White where the logarithm is 128 or more: 127 cells. The fold adds 128 to a logarithm, so a cell and its fold partner, p and 257 − p, are never of one shade: turn the picture half a turn, step it two cells on, and it is its own negative for the cells 2 to 255.
No listing makes this panel; it is a cut of the table at the half-way level. From the arithmetic, all of it.
Residues
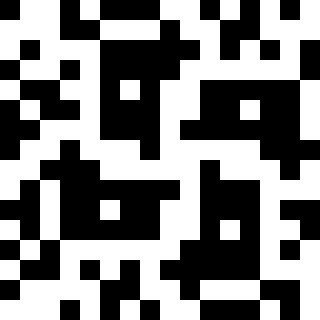
white where dlog is even
White where the logarithm is even: the squares of the field, 127 of the cells 1 to 255 (there are 128; the last, 256, is past the end of the picture). The fold keeps the character, so this panel is the same turned half a turn and stepped two cells on. 16 is a square, 4², so multiplying by 16 keeps the character too, and the panel is the same turned a quarter turn, for the 225 cells inside.
No listing makes this panel. From the arithmetic, all of it.
The transform's magnitudes
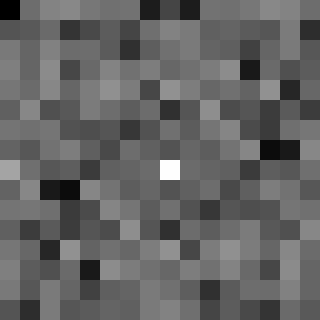
|F(u,v)|, log scale, (0,0) at the centre
The ordinary Fourier transform of the picture in two dimensions, its magnitudes on a logarithmic scale, the mean, (0, 0), at the centre. No listing of the chapter makes it; it is kept from the first sheet. In (u, v), u counts the turns down the sixteen rows and v across the sixteen columns; (u, v) and (16 − u, 16 − v) have one magnitude, which is why the panel is the same turned half a turn about its centre.
After the mean the strongest component is (0, 8), of magnitude 15.50, and the next (4, 0), 9.96. Component (0, 8) sets the even columns against the odd: the even cells' logarithms add to 18240 and the odd cells' to 14272.
Counted.
IIThe inverses, 16 × 16
The table of inverses for the cells 0 to 255, sixteen to a row, by the same twelve steps.
The inverse table as a picture
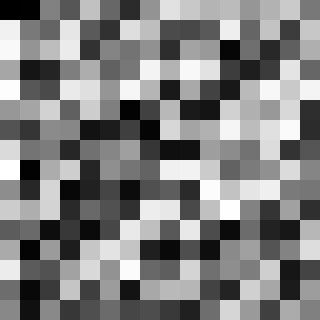
grey level = the inverse, 0 black to 255 white
Cell p holds its inverse, the q with p × q ≡ 1 mod 257. Cell p stands at column p mod 16, row p div 16; black is 0, white 255. The seed has no inverse and is written 0. 256 = −1 is its own inverse and is past the end of the picture, so the cells 1 to 255 hold 1 to 255 in another order: all 256 levels stand, each once. Only cell 1 holds itself.
The picture is its own key: if cell p holds q, cell q holds p. Multiplying by 16 turns it a quarter turn for the 225 cells inside, and every level is multiplied by 241 = 16−1. Under the fold, p → 257 − p, a level L becomes 257 − L.
Neighbouring cells are unlike: the mean step from a cell to the one on its right is 80.2 levels. No two neighbours hold consecutive values.
From the arithmetic: that every level stands once, and that the picture read as a table of pairs is the same from either side.
Its histogram, Listing 7.5
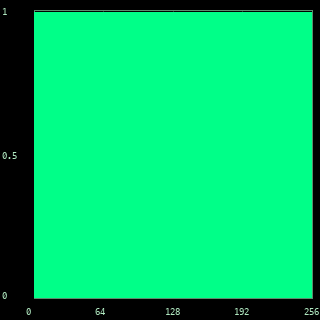
levels 0 to 255; twice none · none none
Listing 7.5 counts how many elements hold each level; the levels run 0 to 255 from left to right. All 256 levels are used and every bar is 1 high: there is no mark under the axis, no level being held twice or by none.
This is the flattest histogram a picture of 256 elements can have. From the arithmetic, all of it.
Flattened, Listing 7.6
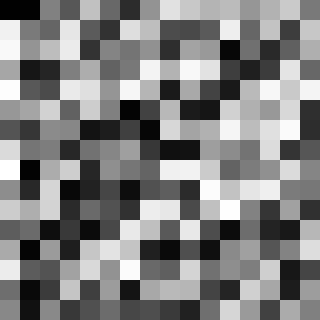
new level = whole part of 255 × sum + 0.5
Listing 7.6 adds the histogram up from level 0, in single precision, and sends level i to the whole part of 255 × sum + 0.5. A histogram is flattened by moving crowded levels apart and thin ones together.
This picture was flat before. By the listing as printed it is moved all the same: of the 256 levels 128 move, levels 0 to 127 go up by 1. After it 255 levels are used, level 128 held twice and level 0 by none. To the eye the panel is the table again; the change is one level over part of its range.
The text beside the listing says that a picture whose histogram is flat already is left as it is. The listing as printed does not leave it. Its running sum counts the level itself, so in a picture of every level once level i is sent to the whole part of 255 (i + 1)/256 + 0.5, which is i + 1 up to level 127 and i from 128 on.
Counted, by the listing's own steps.
The histogram after flattening
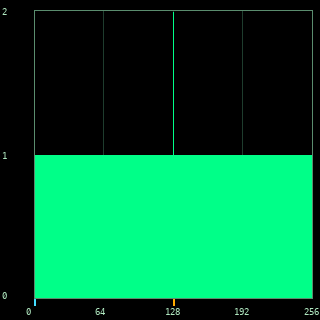
twice 128 · none 0
The same count after Listing 7.6. The amber marks are the levels now held twice, 128, and the blue marks the levels now held by none, 0. A routine meant to make a histogram flat has made a flat one a little less so.
Counted.
Blurred, Listing 7.7
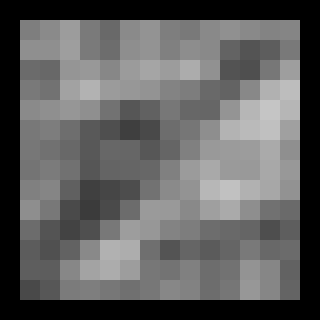
convol2d, 1 2 1 / 2 4 2 / 1 2 1 over 16
Listing 7.7, convol2d, lays the kernel 1 2 1 / 2 4 2 / 1 2 1 on every place it fits, adds the nine products, and divides by 16, the sum of the kernel's magnitudes; the quotient is cut toward 0, as C divides whole numbers.
The black frame is the dead band: the kernel does not fit on the outermost ring, and the routine leaves that ring at the 0 its memory was given out with. Inside it the levels run only from 59 to 197. The table's neighbours being unlike, their weighted mean is drawn toward the middle of the range everywhere, and the blur is nearly one grey.
Counted.
Median, 3 × 3, one pass, Listings 7.11 and 7.12
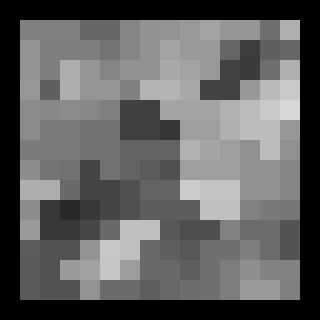
choice 3, one pass
Listing 7.11, nonlin2d, takes the nine elements about a place, sorts them, and writes the middle one; Listing 7.12 is the program about it, asking which of three filters and how many passes. Here the choice is 3, the median, and one pass.
Inside the dead band the result runs from 41 to 216 with an average of 127.3, on 88 levels in all. A median keeps what a neighbourhood agrees on and drops what stands alone; in a table where every level stands once nothing agrees, and what is left is a coarser table, each element a level that one of its nine neighbours held.
Counted.
Gradients, Listing 7.10
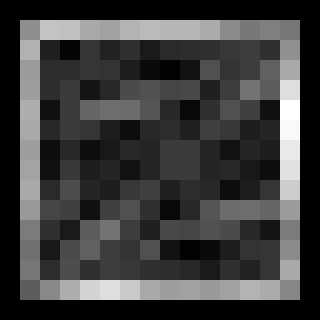
Min 0 Max 95 Avg 23.0
Listing 7.10, EDETECT, makes three passes of convol2d: the blur of the panel above, then on the blur two Sobel kernels, one for steps across and one for steps down, each sum divided by 8. At every element it keeps the larger of the two magnitudes. It reports Min = 0, Max = 95, Avg = 23.0, the average taken over all 256 elements as the listing takes it. The panel is stretched from black at Min to white at Max.
The bright frame is not the table's. The blur's dead band is 0 and the blur inside it is near the middle grey, so just inside the dead band the Sobel kernels find a step all the way round. That is the listing meeting its own frame.
Counted.
Edges over 16
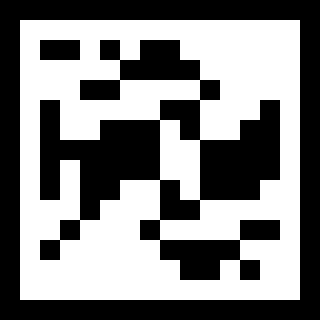
132 elements
The edge routine asks the reader for a threshold between Min and Max and writes 255 where the gradient is over it and 0 elsewhere. Over 16 stand 132 of the 256 elements.
16 is here to be held against the first sheet, which showed the edges above 128 with the Sobel sums not divided: 133 elements. The listing divides by 8, and 128 over 8 is 16. By the listing 128 itself is outside Min to Max and is refused.
Counted.
Edges over 46, twice the average
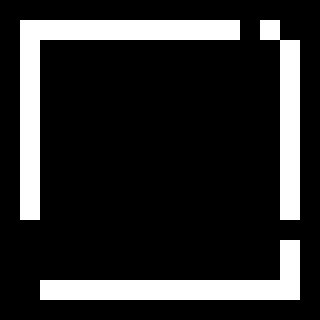
45 elements
Over 46, twice the average gradient, stand 45 elements: 45 on the frame just inside the dead band and none inside. The threshold is a choice made for these pages; the listing asks for it.
So by this measure the inverse table has almost no edges of its own: what the routine finds is the frame. The first sheet's gradients, not divided, find the same elements over twice their own average, 375.
Counted.
Light and dark
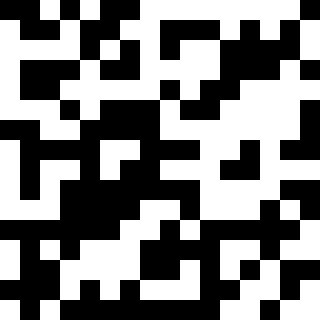
white where the inverse is 128 or more
White where the inverse is 128 or more: 128 cells. Under the fold a level L becomes 257 − L, so of a cell and its fold partner one is light and one dark, but for the pair whose levels are 128 and 129.
No listing makes this panel; it is a cut of the table at the half-way level. Counted.
Above and below
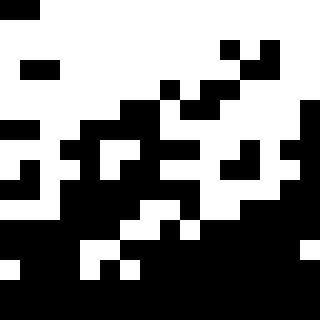
white where the inverse is more than the cell
White where a cell's inverse is more than the cell itself: 127 cells. The cells pair off, each with its inverse, and in every pair one is the greater; only cell 1 is its own pair. So the white cells are one of each pair, 127 of the 254.
No listing makes this panel. From the arithmetic, all of it.
The transform's magnitudes
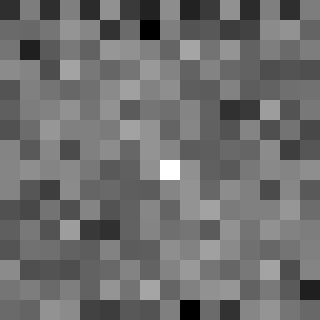
|F(u,v)|, log scale, (0,0) at the centre
The ordinary Fourier transform of the picture in two dimensions, its magnitudes on a logarithmic scale, the mean, (0, 0), at the centre. No listing of the chapter makes it; it is kept from the first sheet. In (u, v), u counts the turns down the sixteen rows and v across the sixteen columns; (u, v) and (16 − u, 16 − v) have one magnitude, which is why the panel is the same turned half a turn about its centre.
After the mean the strongest component is (6, 15), of magnitude 12.29, and the next (11, 11), 11.67.
Counted.
IIIThe plane, 257 × 257, in grey
Every point a + bφ of the plane but the zero point is a power of 2 + φ: (2 + φ)k, k from 0 to 66047. That k is the point's cell. The point stands at column a, row b, row 0 at the top.
A cell is too large for the listings, which take a short whole number to an element. So the cell is taken in its two parts, cell = fibre + 256 × row. The fibre, 0 to 255, is the logarithm to the base 5 of the point's norm, 5 being the norm of 2 + φ. The row, 0 to 257, is one of the 258 rows of the store, as many as the projective line has points. With them stands the norm itself, a² + ab − b² mod 257, 0 to 256. The zero point has no cell; it is written 66048, which gives it the fibre 0 and the row 258.
Eighteen pictures, six to each of the three: the picture, its histogram, the picture flattened, the median, the gradients, and the edges over twice the average.
The fibre of every point
the cell mod 256 = the logarithm base 5 of the norm
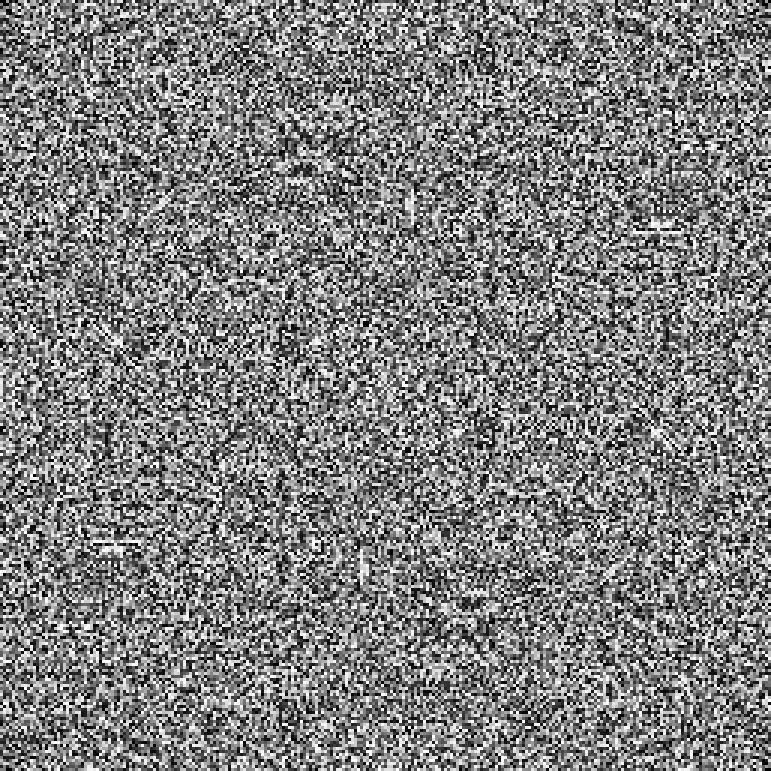
The fibre of the point a + bφ at column a, row b: its cell mod 256, which is the logarithm to the base 5 of its norm. Black is 0, white 255.
To the eye it has no shape. What it has is exact. A point and its negative have one norm, so the block of columns and rows 1 to 256 is the same turned half a turn about its centre. Multiplying a point by φ² sends (a, b) to (a + b, a + 2b) and leaves the norm as it is, φ² having the norm 1: that map, which shears the picture and wraps it, carries the fibre picture into itself, element for element.
Between neighbours the mean step, folded at 256, is 64.01; levels placed without regard to each other give 64.00.
From the arithmetic: the two symmetries. Counted: the step.
The histogram of the fibre, Listing 7.5
level 0 holds 259, level 255 holds 258
Every level from 1 to 255 is held by 258 points and level 0 by 259: the histogram is flat but for one element. 258 is the number of points of any one norm, the projective line's count; the one over is the zero point, which has no cell and whose written value, 66048, has the fibre 0.
From the arithmetic: that every norm but 0 is taken 258 times.
The fibre flattened, Listing 7.6
128 levels move
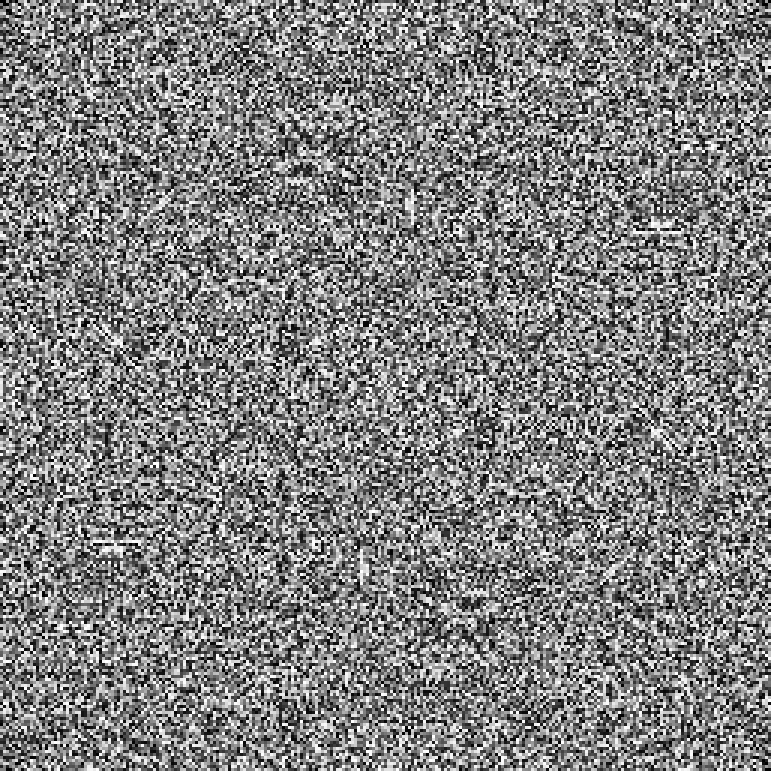
Listing 7.6 on a histogram flat but for one element: 128 of the 256 levels move, the levels 0 to 127 up by one, and level 0 is left empty. To the eye the panel is the picture again.
Counted.
The fibre: median, 3 × 3, one pass
Listings 7.11 and 7.12, choice 3
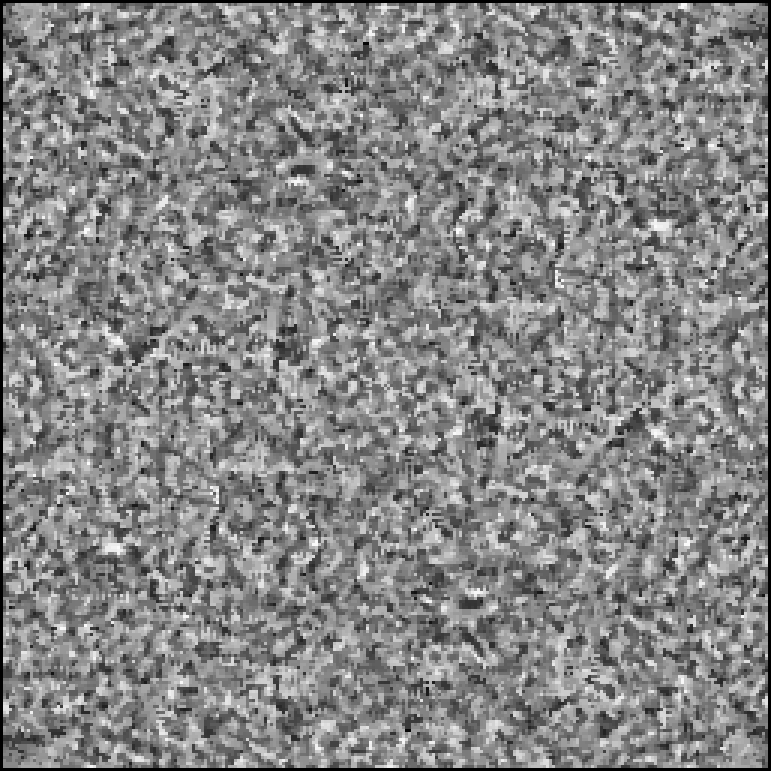
The middle one of each nine. It runs from 0 to 240 with an average of 125.7, and the panel is stretched from its least to its greatest. The grain is coarser than the picture's and nothing gathers: the fibre has no neighbourhoods that agree.
Counted.
The fibre: gradients, Listing 7.10
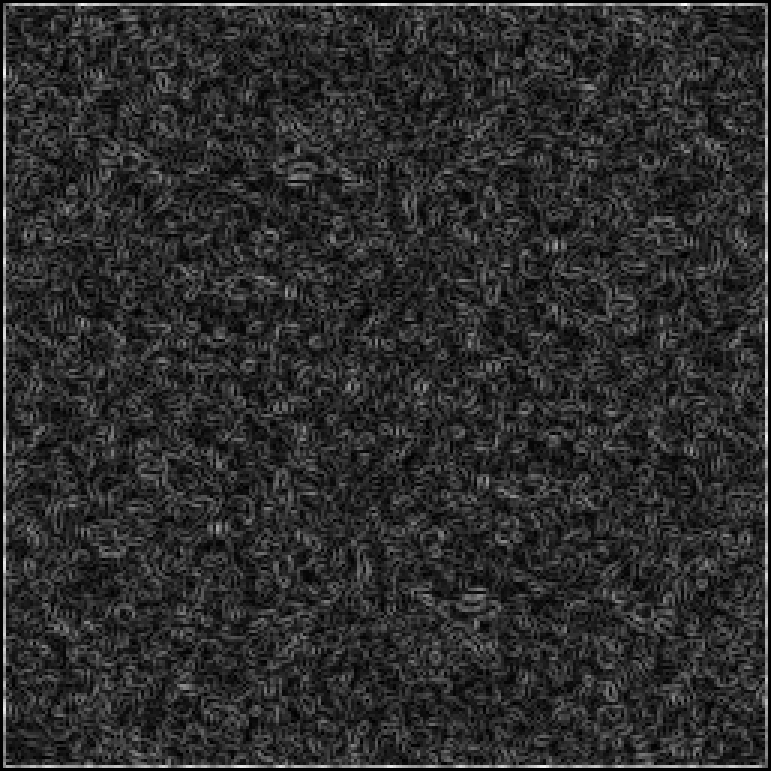
Min 0 Max 99 Avg 17.3
EDETECT's three passes. Min = 0, Max = 99, Avg = 17.3 over all 66049 elements. On the frame just inside the dead band the gradients average 63.6, the step from the blur's black frame; inside they average 16.9 and run to 64. The routine prints the rows it has reached, 0 16 … 240, on each pass, as the text's own dialogue shows.
Inside columns and rows 3 to 254 this panel is the same turned half a turn, element for element: the gradient of a picture that is its own half turn.
From the arithmetic: the half turn. Counted: the figures.
The fibre: edges over 35
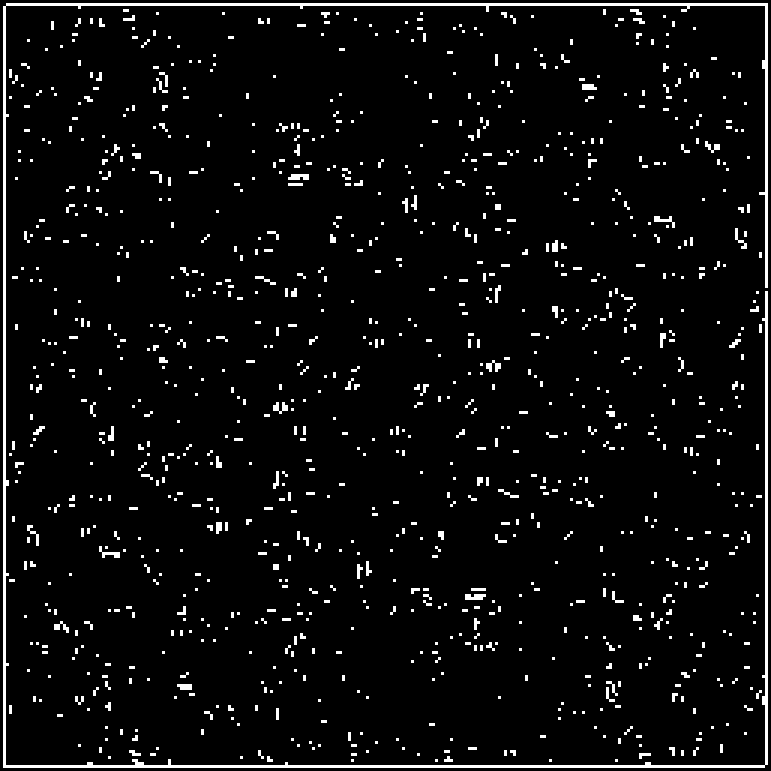
3152 elements; twice the average
Over 35, twice the average, stand 3152 elements: 1013 of the 1016 on the frame and 2139 inside, 3.34 in a hundred. Inside they make 1056 strokes of 1 to 12 elements, 2.03 on average, 492 of them a single element.
The same levels put in a shuffled order, twenty times over, give 2138 edges inside, more or less 85, in 1073 strokes, more or less 32, of 1.99 elements on average. By these counts the fibre and a shuffle of it are not told apart. What tells them apart is the half turn: of the 2130 edge elements inside columns and rows 3 to 254, every one has its partner across the centre, 2130 of 2130.
The norm is 5 raised to the fibre. The norm's picture has five stars and wide bands; its logarithm scatters them, neighbouring norms having logarithms that are far apart. The two pictures hold the same thing.
From the arithmetic: the half turn. Counted: the rest. The threshold is a choice made for these pages.
The row of every point
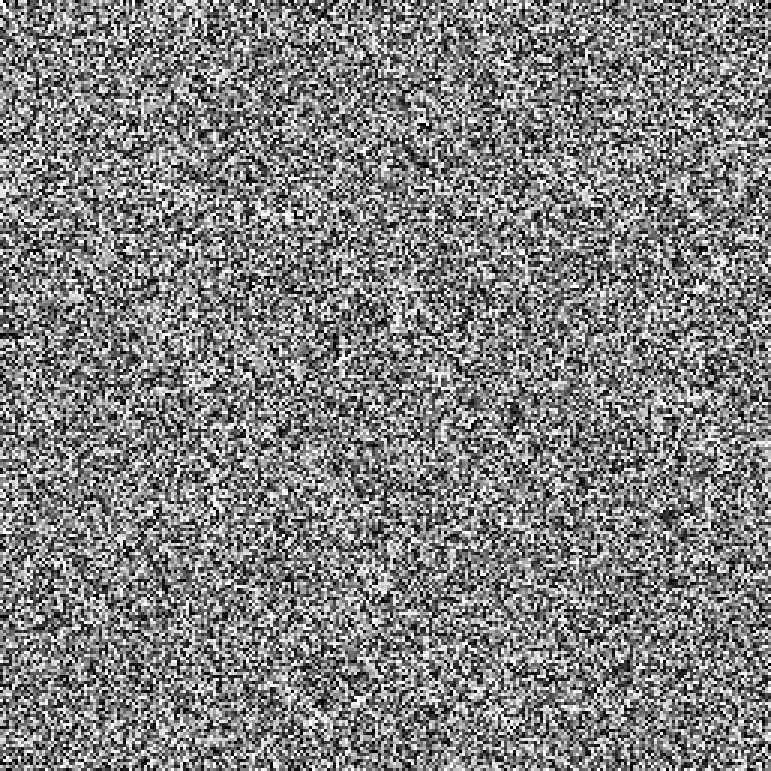
the cell div 256, 0 to 257
The row of the point a + bφ: its cell div 256, from 0 to 257. Black is 0; rows 255, 256 and 257 are all shown white, a grey level ending at 255.
Multiplying a point by φ² takes 256 from its cell, which is one row: the map (a, b) → (a + b, a + 2b) carries this picture into itself one row lower, row 0 going to row 257. A point's negative is 33024 cells on, 129 rows: the picture turned half a turn is itself with 129 added to every row, mod 258.
Between neighbours the mean step, folded at 258, is 64.52; levels placed without regard to each other give 64.50.
From the arithmetic: the two maps. Counted: the step.
The histogram of the row, Listing 7.5
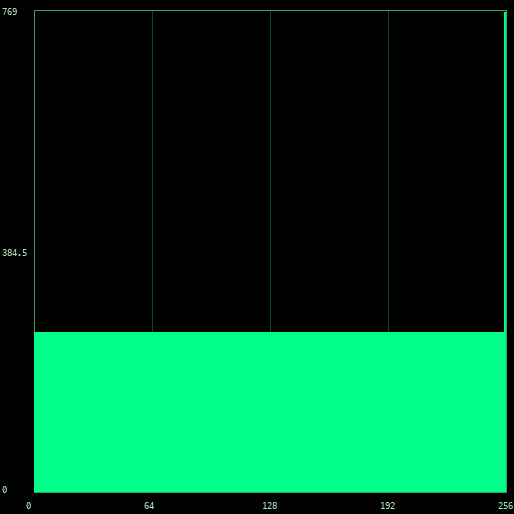
level 0 holds 256, level 255 holds 769
Every level from 0 to 254 is held by 256 points, a row of the store having 256 cells. Level 255 holds 769: its own 256 and the 513 elements of rows 256 and 257 and of the zero point, which are over 255. Listing 7.5 counts what is over its greatest level at that level.
From the arithmetic: 256 to a row. The listing's: that 513 are counted at 255.
The row flattened, Listing 7.6
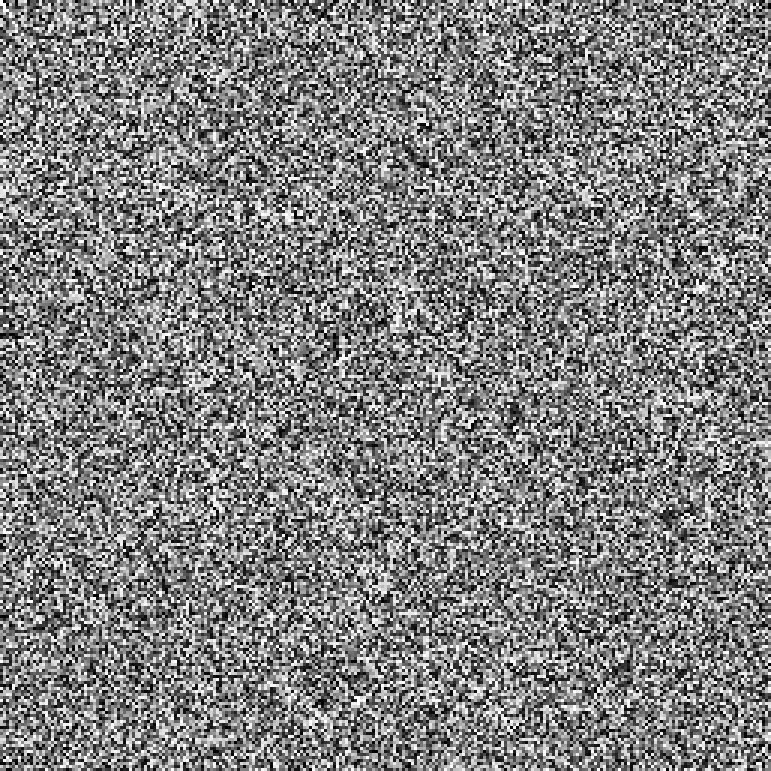
169 levels move
Of the 256 levels 169 move, and levels 0, 253 and 254 are left empty: the crowd at 255 draws the levels under it together.
Counted.
The row: median, 3 × 3, one pass
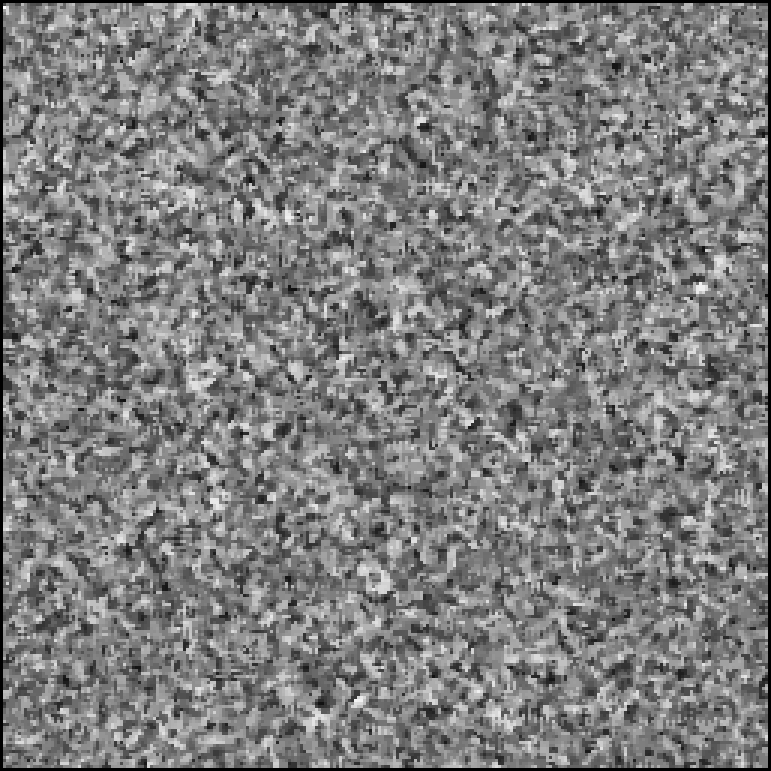
Listings 7.11 and 7.12, choice 3
It runs from 0 to 256 with an average of 126.7. As with the fibre, nothing gathers.
Counted.
The row: gradients, Listing 7.10
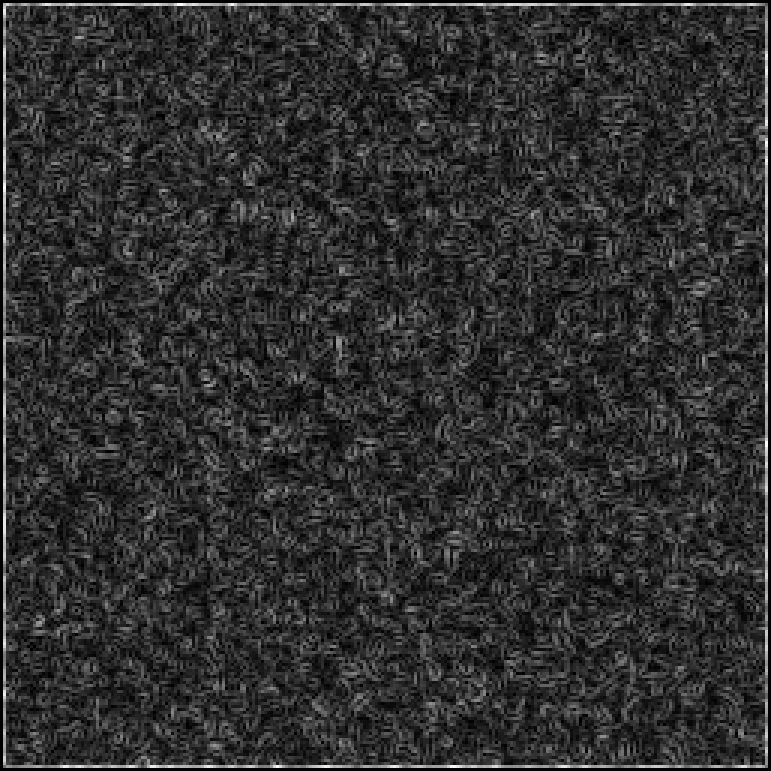
Min 0 Max 94 Avg 17.5
Min = 0, Max = 94, Avg = 17.5. On the frame the gradients average 62.7; inside 17.0, running to 63.
This panel is not its own half turn. The rows of a point and its negative differ by 129, and a difference of grey levels is not kept when 129 is added mod 258 to both: where one of the two passes 257 it falls to 0 and a small step becomes a great one.
Counted.
The row: edges over 35
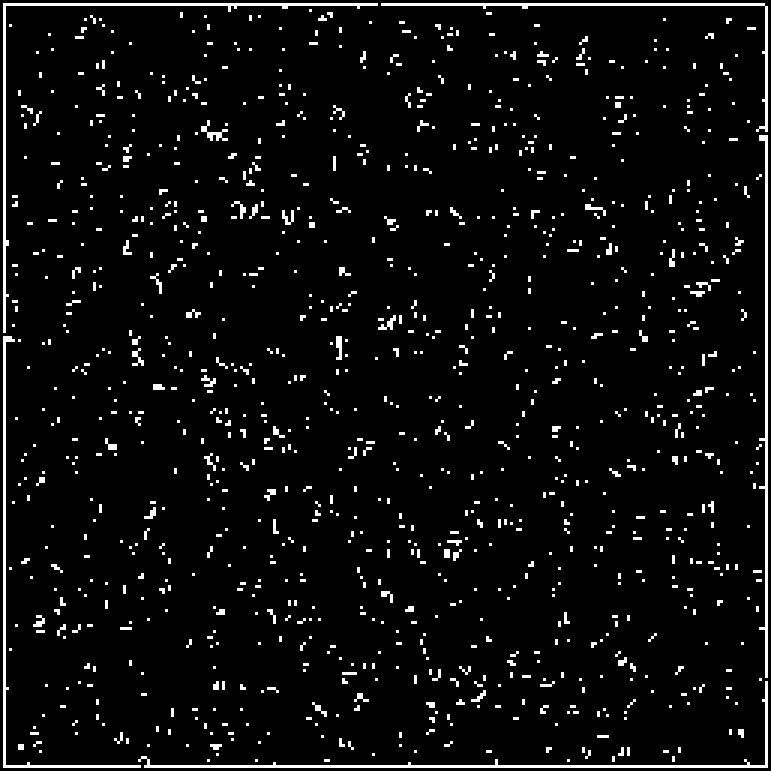
3275 elements; twice the average
Over 35 stand 3275 elements: 1010 on the frame and 2265 inside, 3.54 in a hundred, in 1093 strokes of 1 to 21 elements, 2.07 on average.
Of the 2251 edge elements inside columns and rows 3 to 254, 116 have their partner across the centre. The row's edges do not keep the half turn, as the fibre's do.
Counted. The threshold is a choice made for these pages.
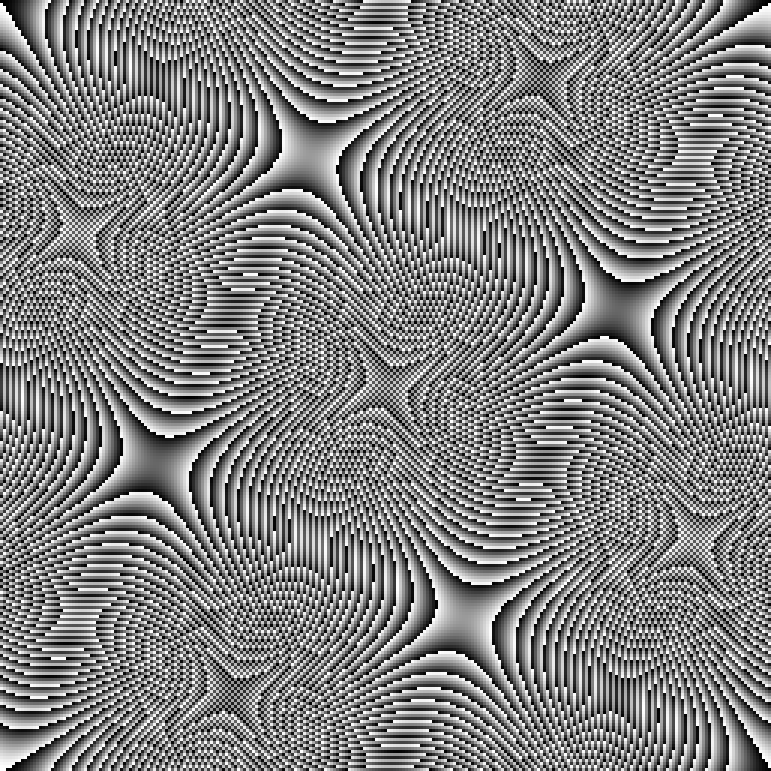
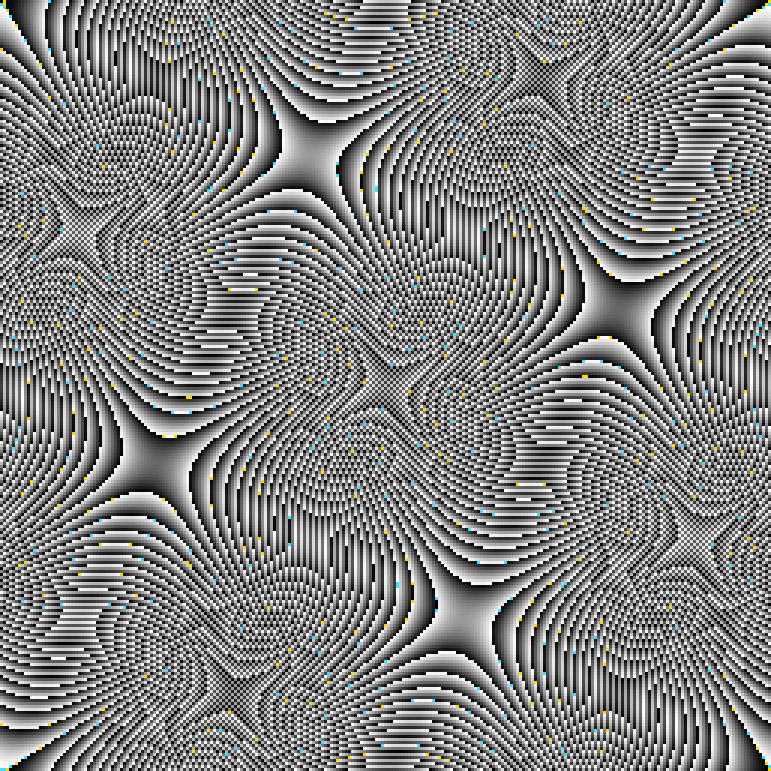
The norm of every point
a² + ab − b² mod 257, 0 to 256
The norm of the point a + bφ at column a, row b: a² + ab − b² mod 257. Black is 0; 255 and 256 are both shown white.
This picture has shapes, and they are those of the form x² + xy − y². The form is 0 along two lines through a point, of slopes φ and −1/φ, which stand at right angles, the first at 58.28° to the a axis; between them its level lines are hyperbolas. It is a saddle.
Moving from a point (a₀, b₀) by (x, y) changes the norm by (2a₀ + b₀)x + (a₀ − 2b₀)y + (x² + xy − y²). Where both of the first two are multiples of 257 the picture about that point is the bare saddle: a star of four arms. That is so at five places, the fifths of the picture, 257/5 = 51.4 apart: the corner, and nearest the whole points (103, 51), (206, 103), (51, 154), (154, 206). 103 is a fifth in the field, 5 × 103 = 515 = 2 × 257 + 1. They are five because the form's discriminant is 5.
Everywhere else the first differences are not 0, the norm climbs fast and wraps at 257 again and again, and the bands are fine. Where the first differences are halves of 257 the levels alternate about a saddle, a star on a chequer; there are fifteen such places, one at the centre.
The picture is its own half turn, a point and its negative having one norm. Between neighbours the mean step, folded at 257, is 64.25, as of levels placed without regard to each other, 64.25: the wide bands about the stars are few against the fine ones.
From the arithmetic: the saddle, its arms, the five places and the half turn. Counted: the step.
The histogram of the norm, Listing 7.5
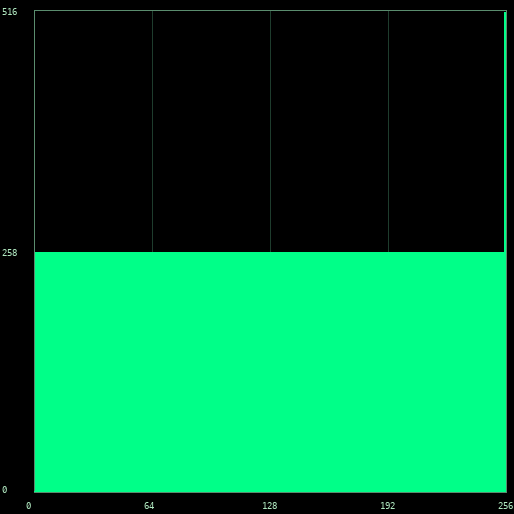
level 0 holds 1, level 255 holds 516
Every level from 1 to 254 is held by 258 points. Level 0 holds 1, the zero point: no other point has the norm 0, the form having no root on the line. Level 255 holds 516: the 258 points of norm 255 and the 258 of norm 256 = −1, which Listing 7.5 counts at its greatest level.
So the shapes of the picture are not in how many points hold a level, which is the same for every level, but in where they stand.
From the arithmetic: 258 to a norm. The listing's: that −1 is counted with 255.
The norm flattened, Listing 7.6
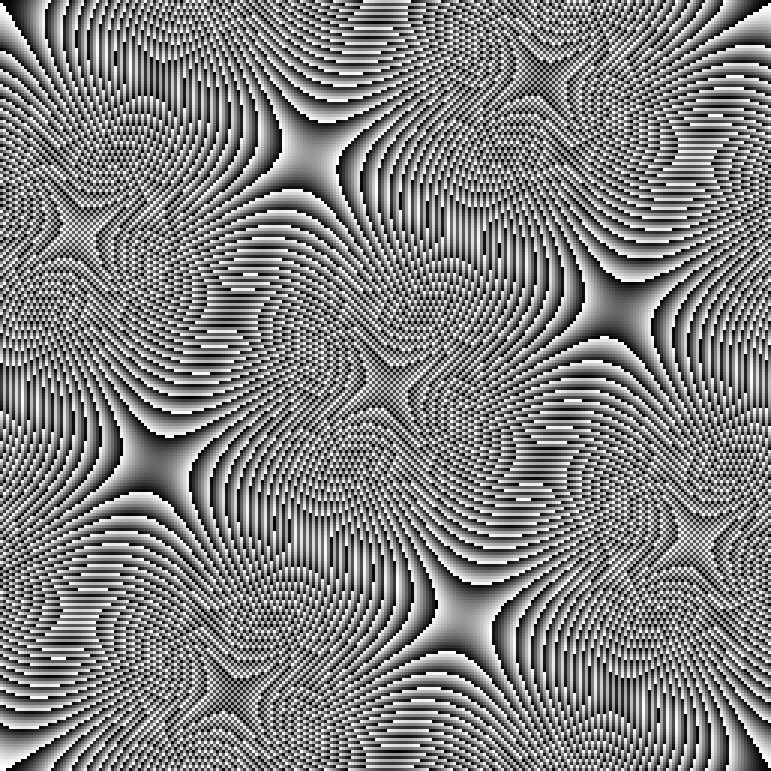
126 levels move
Of the 256 levels 126 move and level 254 is left empty. To the eye the panel is the picture again.
Counted.
The norm: median, 3 × 3, one pass
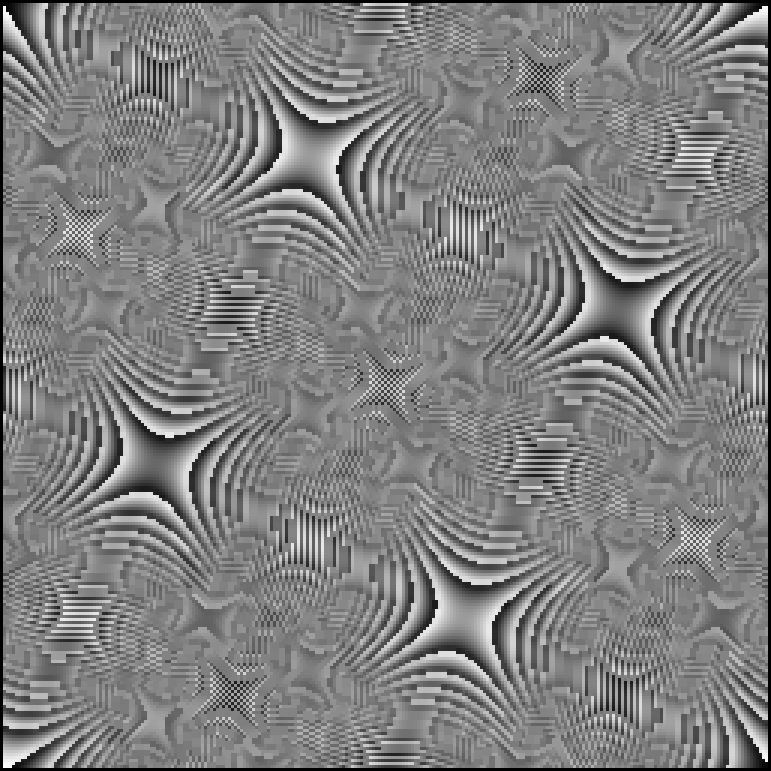
Listings 7.11 and 7.12, choice 3
The middle one of each nine, from 0 to 252, average 126.5, stretched from least to greatest. Where the bands are wider than the nine, about the five stars, the median leaves them as they are. Where they are finer it cannot follow them and gives a middle grey, and in that grey the fainter stars stand out, those on the chequer and others at thirds and quarters of the picture, which the fine bands hid.
Counted; the fainter stars by eye.
The norm: gradients, Listing 7.10
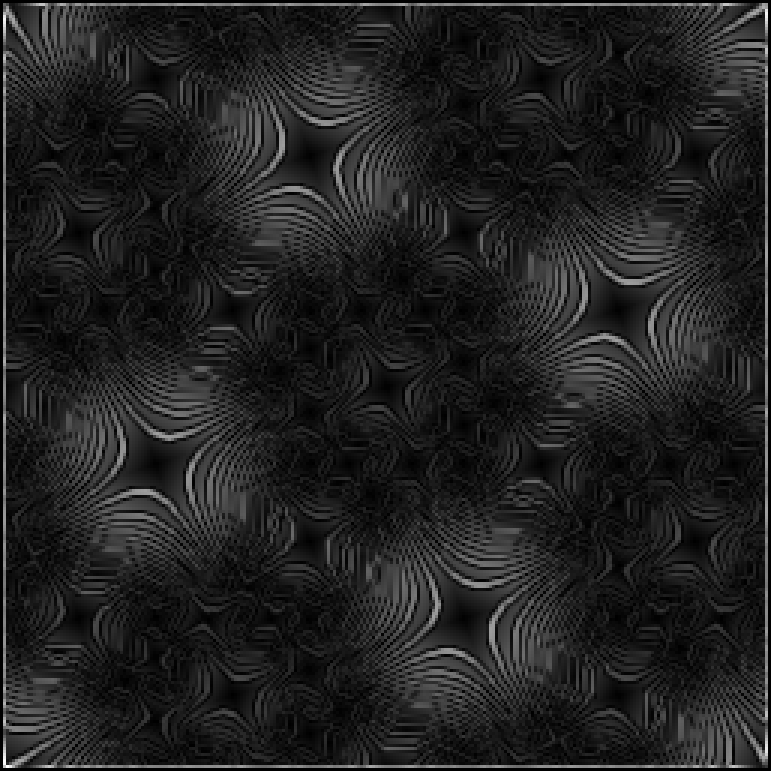
Min 0 Max 121 Avg 16.0
Min = 0, Max = 121, Avg = 16.0. The gradients are high in a ring about each of the five stars. At a star itself the picture is nearly flat and there is little to find; far from it the bands are finer than the kernel and the blur of the first pass takes them out; between, the bands are a few elements wide and the routine follows them.
Inside columns and rows 3 to 254 the panel is the same turned half a turn.
From the arithmetic: the half turn. Counted: the figures.
The norm: edges over 32
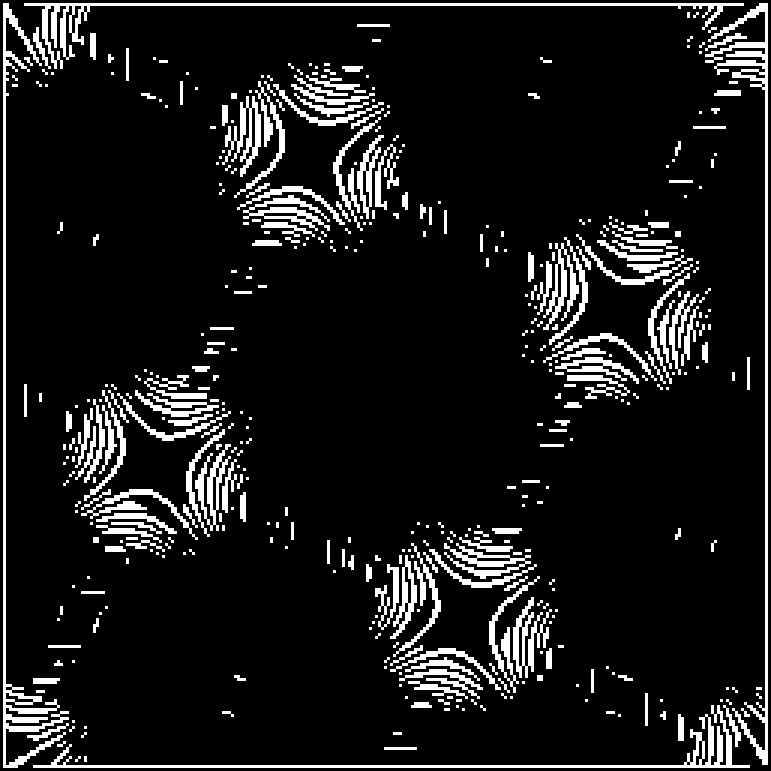
6646 elements; twice the average
Over 32 stand 6646 elements, 995 on the frame and 5651 inside, 8.83 in a hundred: more than twice what the fibre and the row have. They make 482 strokes, the longest of 129 elements, 11.72 on average: arcs of hyperbolas.
They gather about the five stars: within 32 columns and rows of the five stand 5474 of the 6646, on 21125 of the 66049 elements.
From the arithmetic: where the five are. Counted: that the edges gather there. The threshold is a choice made for these pages.
IVThe plane in colour
The cell has two parts and a screen has three colours. The fibre is put in red and the row in green, with blue for the little of the row that is past 255: one picture then holds the whole cell. Red and green together are the yellows and golds of these panels. Each result of the listings on the fibre is put in red and the same result on the row in green; no figure here is new.
The norm is one number and stays grey; on it the units of the plane are marked, gold where the norm is 1 and blue where it is 256 = −1.
The cell of every point, in colour
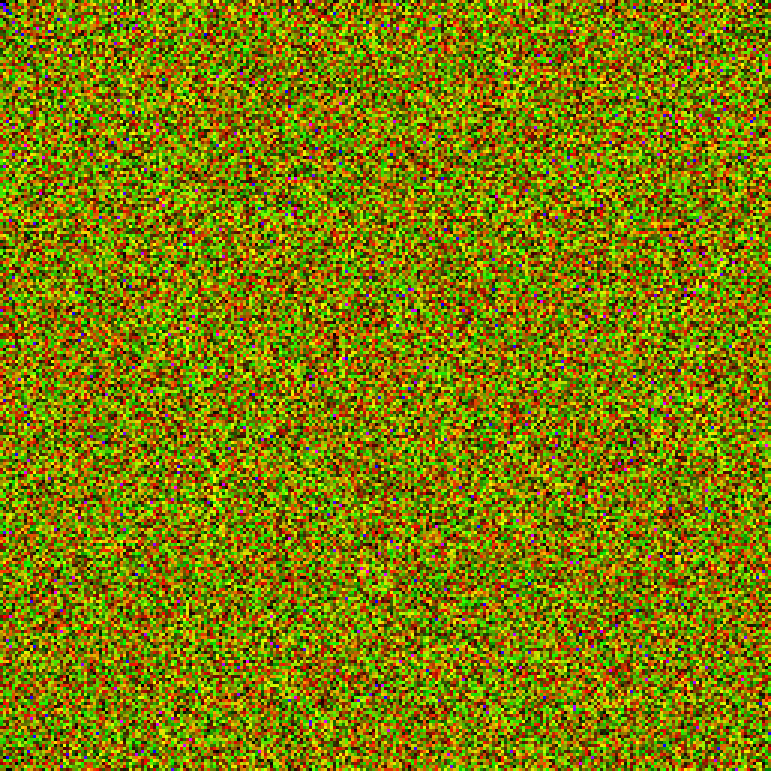
red the fibre, green the row, blue the row past 255
The plane folded into one picture: at column a, row b stands the cell of a + bφ, its fibre in red, its row mod 256 in green, and blue where the row is past 255. The zero point, top left, is black. A point is red where its fibre is high and its row low, green the other way, dark where both are low, yellow where both are high.
512 points have the row past 255, the cells 65536 to 66047: they are the blue ones, with green 0 or 1.
The picture is a table of logarithms for the plane. Read from it alone, every product of two points is made by adding their cells, all 4362338304 of them, and agrees with the product by the rule φ² = φ + 1.
From the arithmetic: that it is a table, every cell once. Counted: the products, all of them.
The cell flattened, in colour
red the fibre flattened, green the row flattened
Listing 7.6 on the fibre, shown in red, and on the row, in green. The fibre moves by one level over half its range and the row by more where the crowd at 255 draws it; to the eye it is the first panel again, without the blue, a flattened level ending at 255.
Counted.
The cell: median, in colour
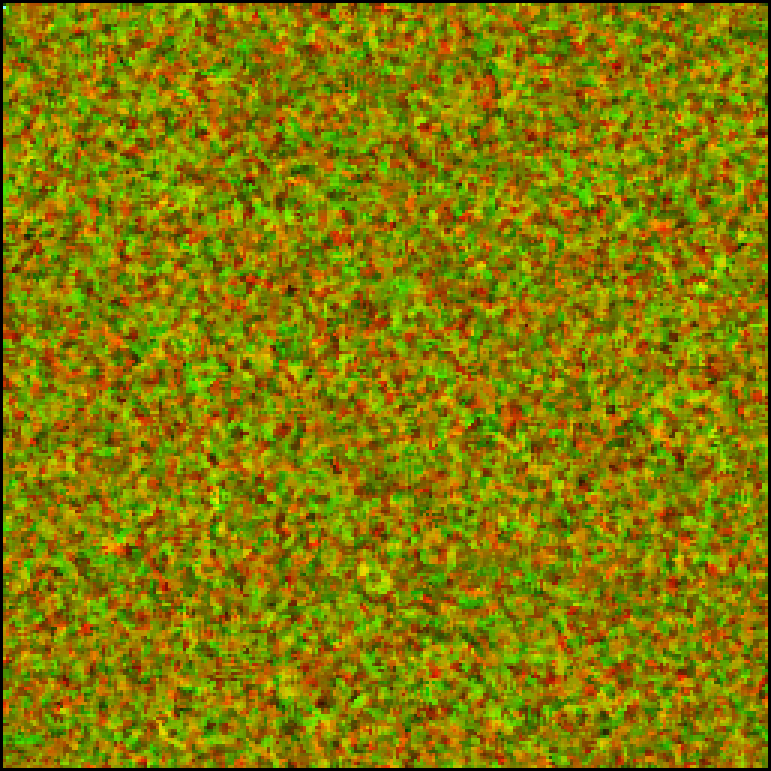
red the fibre's median, green the row's
The median of 3 × 3 on the fibre, in red, and on the row, in green, each stretched from its least to its greatest. The medians keep near the middle of their ranges, so the reds and greens are of middling strength and their mixture is the ochre and gold of the panel; the grain is the nine elements of the kernel.
Nothing gathers in either colour. The mottling is of the size of the kernel and no larger.
Counted; the colour by eye.
The cell: gradients, in colour
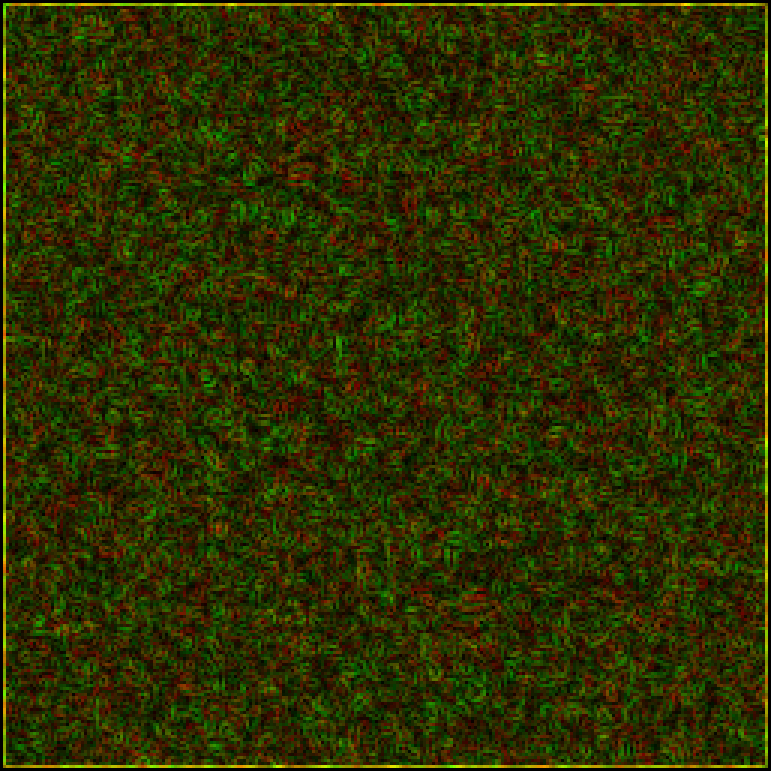
red the fibre's gradients, green the row's
EDETECT's gradients of the fibre in red and of the row in green, each stretched from Min to Max. The thin bright frame is yellow, both pictures meeting the dead band of their own blur. Inside the panel is dark: the greatest gradients are on the frame, and against them those inside are low, 16.9 and 17.0 on average against 63.6 and 62.7.
Counted.
The cell: edges, in colour
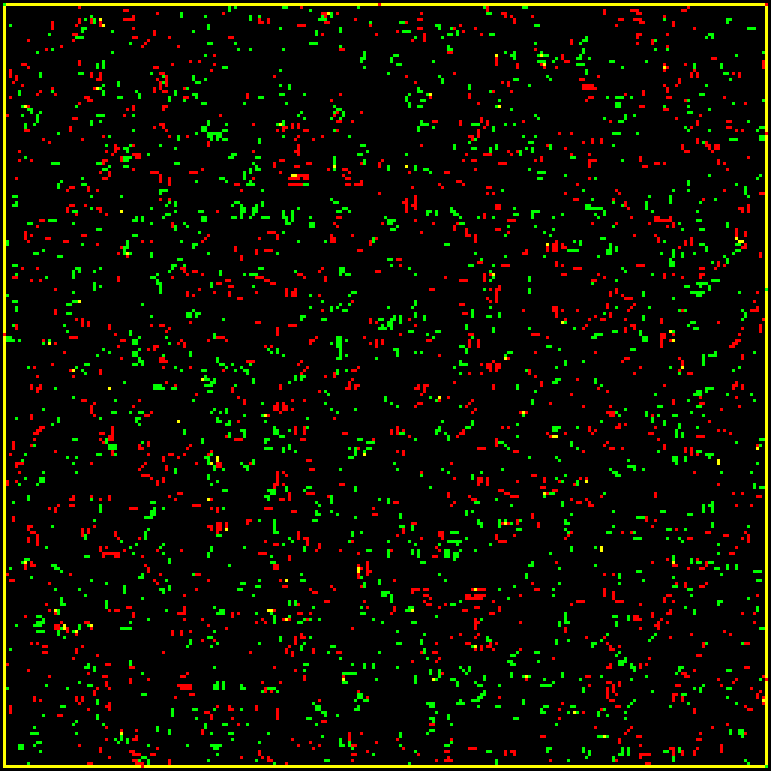
edges over 35 and 35; red the fibre's, green the row's, yellow both
An element is red where the fibre's gradient is over 35, green where the row's is over 35, yellow where both are: 2069 red, 2192 green, 1083 yellow, of 66049.
The yellow frame is the listing's. Just inside the dead band both the fibre and the row step from the blur's black frame to its middle grey, and both are over the threshold nearly all the way round: 1007 of the 1083 yellow elements are on that frame, which has 1016.
Inside the frame the two colours fall without regard to each other. 76 elements are both; if the 2139 of the fibre and the 2265 of the row stood independently on the 64009 elements inside, 75.7 would be.
The marks are short strokes: 1056 of the fibre's and 1093 of the row's, of 2.03 and 2.07 elements on average, the longest of 12 and 21. The routine keeps the larger of a step across and a step down, and the blur before it spreads a step over its neighbours, so an edge is seldom one element alone and seldom long.
The red marks keep a symmetry the green do not. Turn the panel half a turn about its centre: inside columns and rows 3 to 254 every red mark falls on a red mark, 2130 of 2130, the fibre of a point and of its negative being one. Of the green, 116 of 2251 fall on a green mark: the row of a point's negative is 129 rows on, and the steps between grey levels are not kept by that.
From the arithmetic: the half turn of the red. Counted: the rest. The threshold, twice the average, is a choice made for these pages.
The norm, with the units in gold and blue
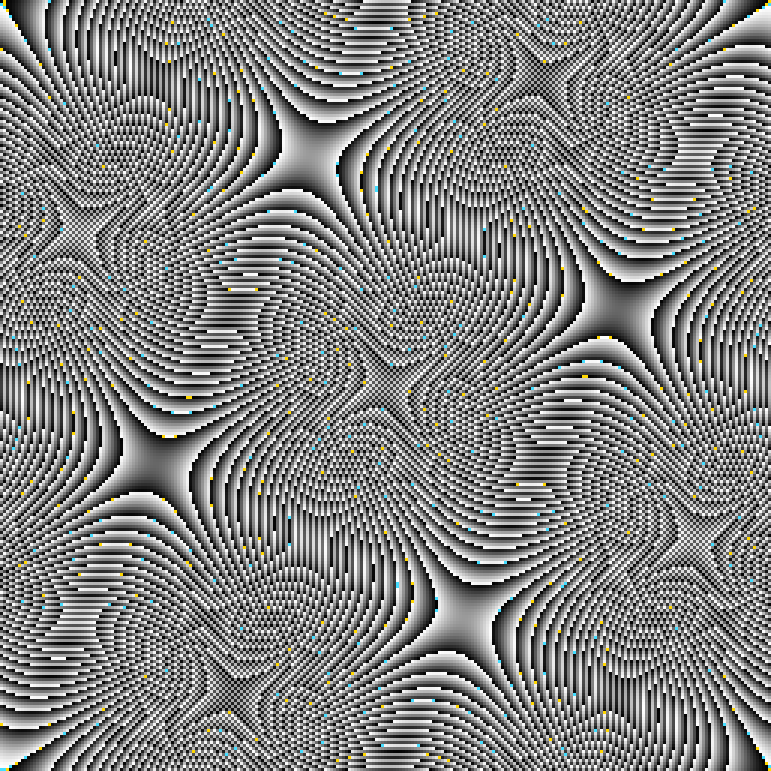
grey the norm; gold norm 1, blue norm 256
The norm picture with the 258 points of norm 1 in gold and the 258 of norm 256 = −1 in blue. Together they are the units of the plane, the 516 powers of φ: the even powers have the norm 1 and the odd −1.
φn = F(n − 1) + F(n)φ, F the Fibonacci numbers: every gold or blue point is a pair of neighbouring Fibonacci numbers mod 257, at column F(n − 1), row F(n). The first of them run out from the top left corner along the arm of slope φ, gold and blue in turn; after a few the numbers pass 257 and the pairs scatter over the picture.
From the arithmetic, all of it.
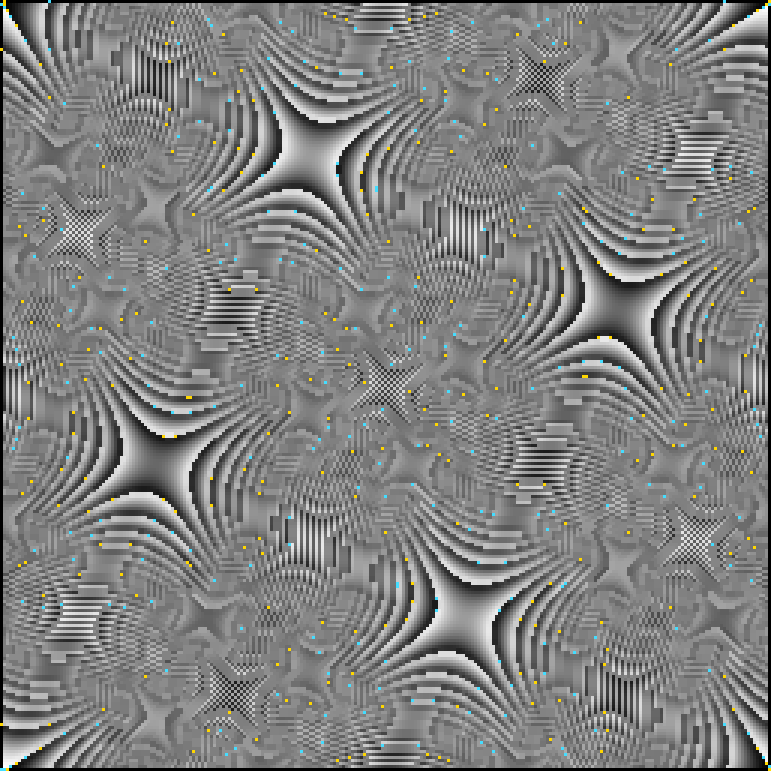
The norm flattened, with the units
gold norm 1, blue norm 256, where they stand
The norm after Listing 7.6, the units marked at their own places. The flattening moves 126 levels by one and the picture is to the eye the same.
Counted.
The norm: median, with the units
Listings 7.11 and 7.12; gold norm 1, blue norm 256
The median of the norm, stretched, with the units marked at their own places. The five stars stand clear and the fainter ones show in the grey between.
After the median the places of the points of norm 1 hold 0 to 129, 96.8 on average, and those of norm 256 hold 0 to 248, 153.2 on average, where the whole picture averages 126.5. A unit of norm 1 is nearly black in the picture and one of norm −1 white, and the median about each leans the same way: their neighbourhoods are not strangers to them.
Of the 516 units 200 stand within 32 columns and rows of the five stars, which is 38.8 in a hundred of them, where 32.0 in a hundred of the picture is within 32.
Counted.
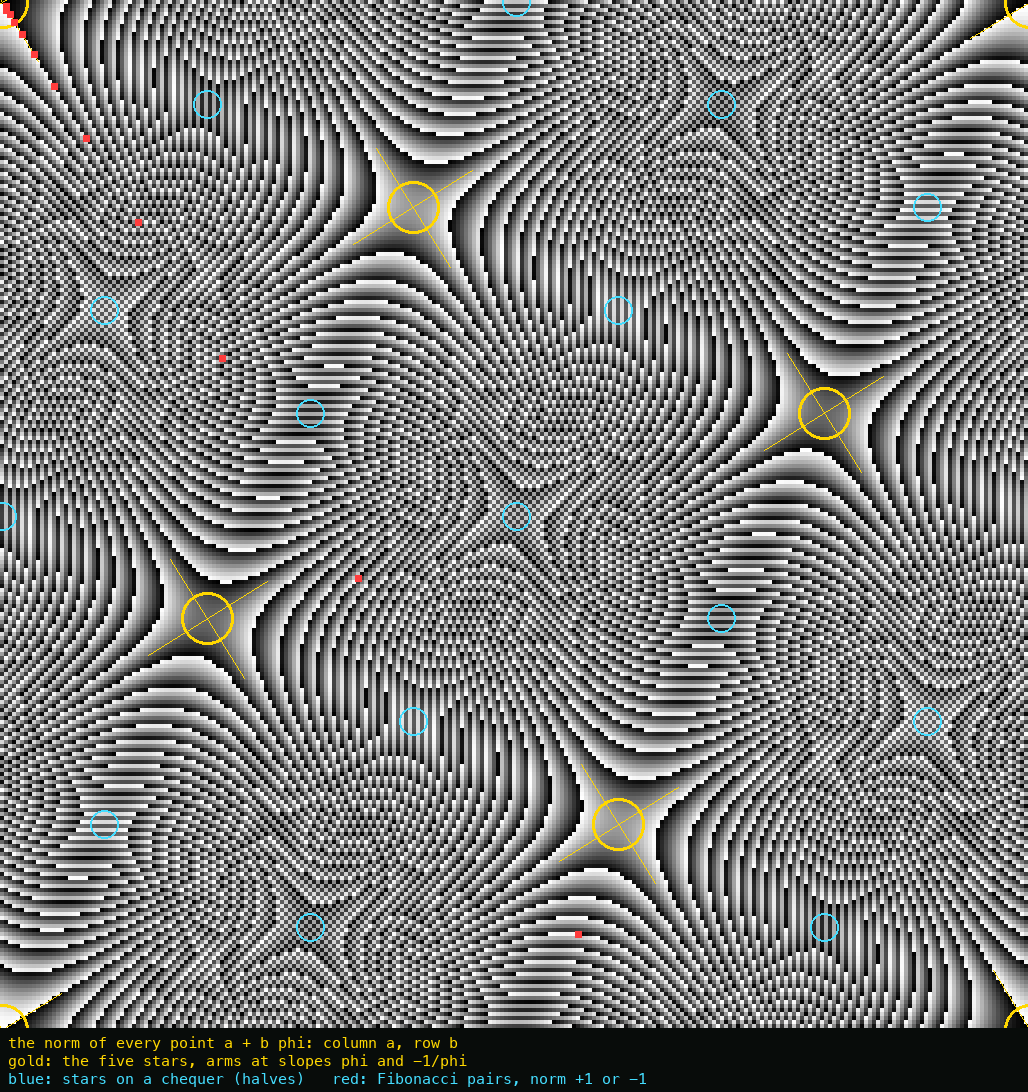
The norm's stars, marked
gold the five stars and their arms; blue the fifteen on a chequer; red the Fibonacci pairs
The norm picture four times enlarged. The gold rings are the five stars, at the fifths of the picture, with their arms drawn at the slopes φ and −1/φ; the star at the zero point is at the four corners, the picture wrapping round. The blue rings are the fifteen places where the first differences are halves of 257, stars on a chequer. The red squares are the pairs of neighbouring Fibonacci numbers, of norm +1 and −1 in turn, going out from the corner along an arm.
From the arithmetic: every mark is placed by a rule and not by eye. By eye: that the shapes of the picture are where the marks are.
VFolded and unfolded
A table of logarithms is the whole arithmetic folded small: every product is a sum of two logarithms. These six pictures are the line and the plane folded into one picture each, and unfolded from it.
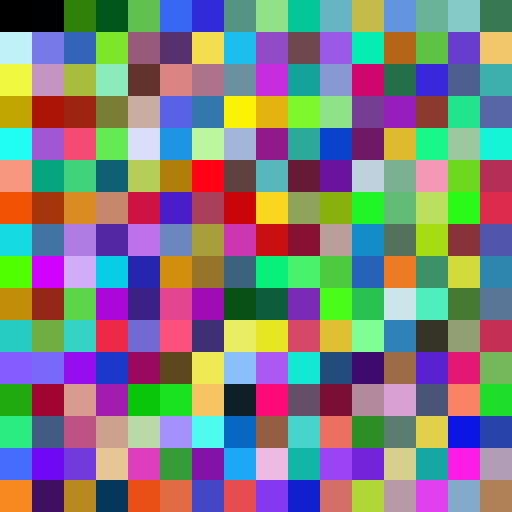
The line folded into one picture
red the logarithm, green the inverse, blue the power
Sixteen by sixteen, cell p at column p mod 16, row p div 16. Each cell holds three numbers as three colours: in red its logarithm, in green its inverse, in blue the power 3p. 256 does not fit a colour's range and is written 0.
The red alone is enough. From it the powers, the inverses, the folds, the characters, the square roots and all 65536 products of the line are made again; the one level missing from the red, 128, is the logarithm of cell 256, which is off the picture.
Counted: every one of those against plain arithmetic.
The line unfolded: every product
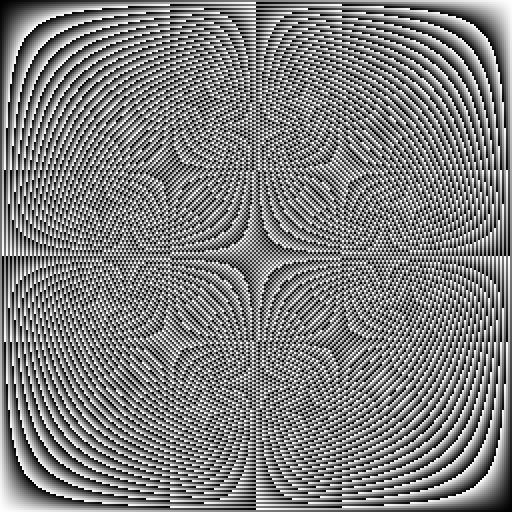
row a, column b, grey the product a × b
The table of multiplication of the field, cells 1 to 256 both ways, made from the folded picture alone: at row a, column b the grey level is a × b mod 257, less 1, so that 1 is black and 256 white.
Every row holds every value once. The picture is the same across its diagonal, a × b being b × a. Fold both cells and the product is the same: the picture is its own half turn. Fold one and the product is folded: turned top to bottom the picture is its own negative. The curves are the hyperbolas a × b = c, wrapped at 257.
From the arithmetic, all of it.
Where the product is 1, and 256
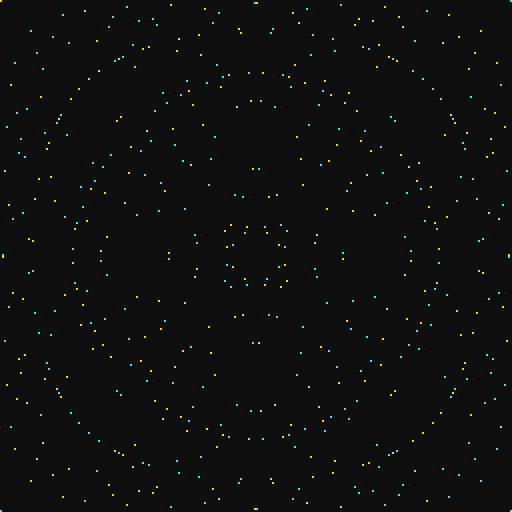
gold the inverse table, blue its fold
Of the 65536 products, the 256 that are 1, in gold, and the 256 that are 256 = −1, in blue. There is one gold point in every row and every column, at row p, column p−1: the gold points are the table of inverses, drawn as a curve. The blue are the same curve folded, at column 257 − p−1.
From the arithmetic, all of it.
The line unfolded by logarithms
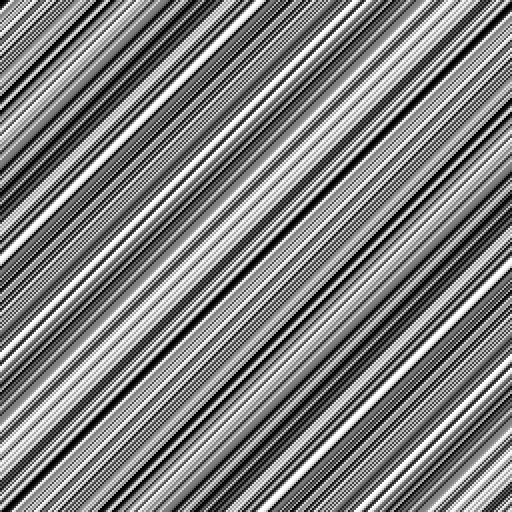
row i, column j, grey 3^(i + j)
The same table with the cells set in the order of their logarithms: at row i, column j stands 3i + j. The value rests on i + j alone, so every stripe from lower left to upper right is of one grey. Multiplication, by logarithms, is addition; the curves of the table before have become straight.
From the arithmetic, all of it.
The plane read the other way: the store
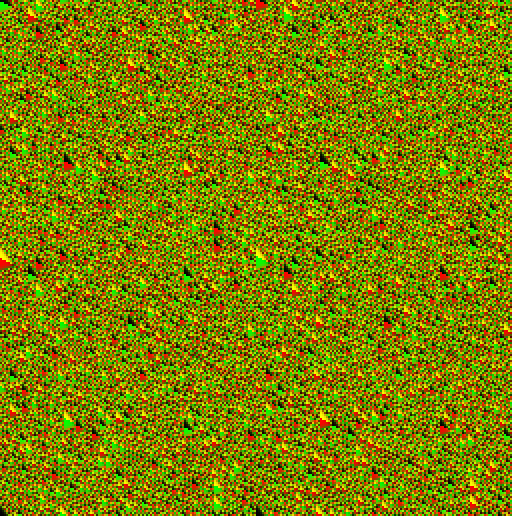
258 rows by 256 fibres; red the a of a cell, green its b
The folded picture of the plane gives the cell of a point. Read the other way it gives the point of a cell: 258 rows of 256, the cell n + 256m at row m, column n, holding the point a + bφ with a in red and b in green.
A column is a fibre: all its points have one norm, 5n. A step down a column is a multiplication by (2 + φ)256 = φ−2, a step along a row one by 2 + φ.
From the arithmetic, all of it.
The plane unfolded: a corner of the products
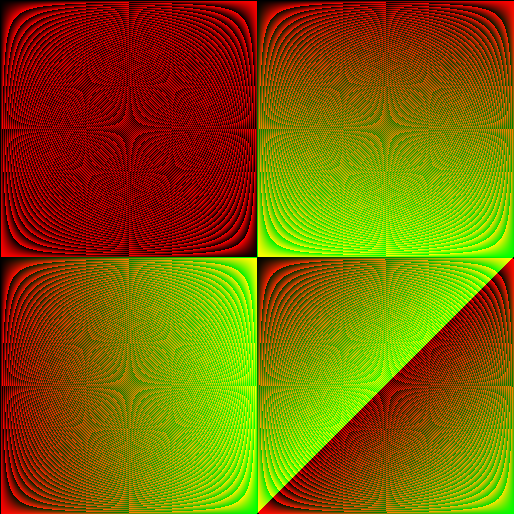
the line and the line + φ, 514 of 66048 each way
The table of all products of the plane would be 66048 each way. This is its corner: the 257 points of the line, a, and the 257 of the line moved by φ, a + φ, each way, 514 by 514; in red the a of the product and in green its b.
Top left, line times line, has no green: the product of two points of the line is on the line. In the other three blocks the rule (a + b₁φ)(c + b₂φ) = (ac + b₁b₂) + (ab₂ + cb₁ + b₁b₂)φ shows: in the last block the φ part is a + c + 1, which passes 257 along one diagonal, the sharp line from corner to corner.
From the arithmetic, all of it.
VIThe sheets whole
The pictures above were made as sheets, several panels to a sheet, each panel with its name under it. Here are the sheets as they were made: first the four made with the routines as the listings print them, then the four first sheets, made before the listings were followed to the letter.
The logarithms, as printed
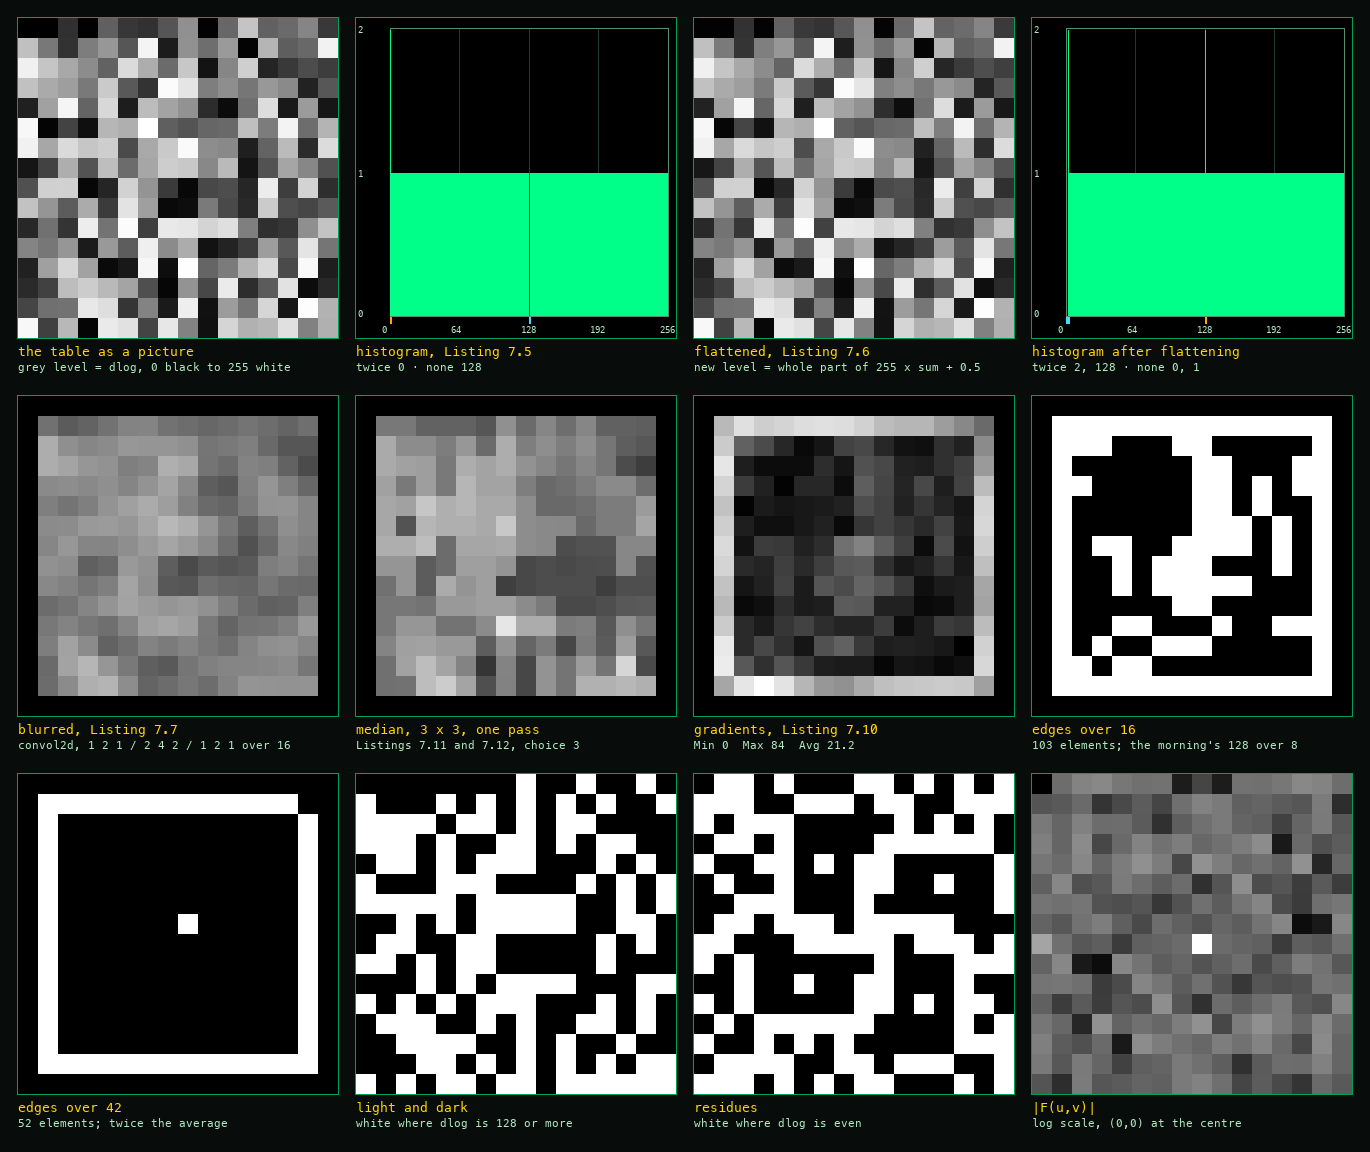
twelve panels: the pictures of section I
The twelve pictures of the logarithm table on one sheet, in the order of section I, four to a row. Every element of the flattened picture, the blur, the gradients and the median on it was held against the machine's own commands on the same table and found the same.
The inverses, as printed
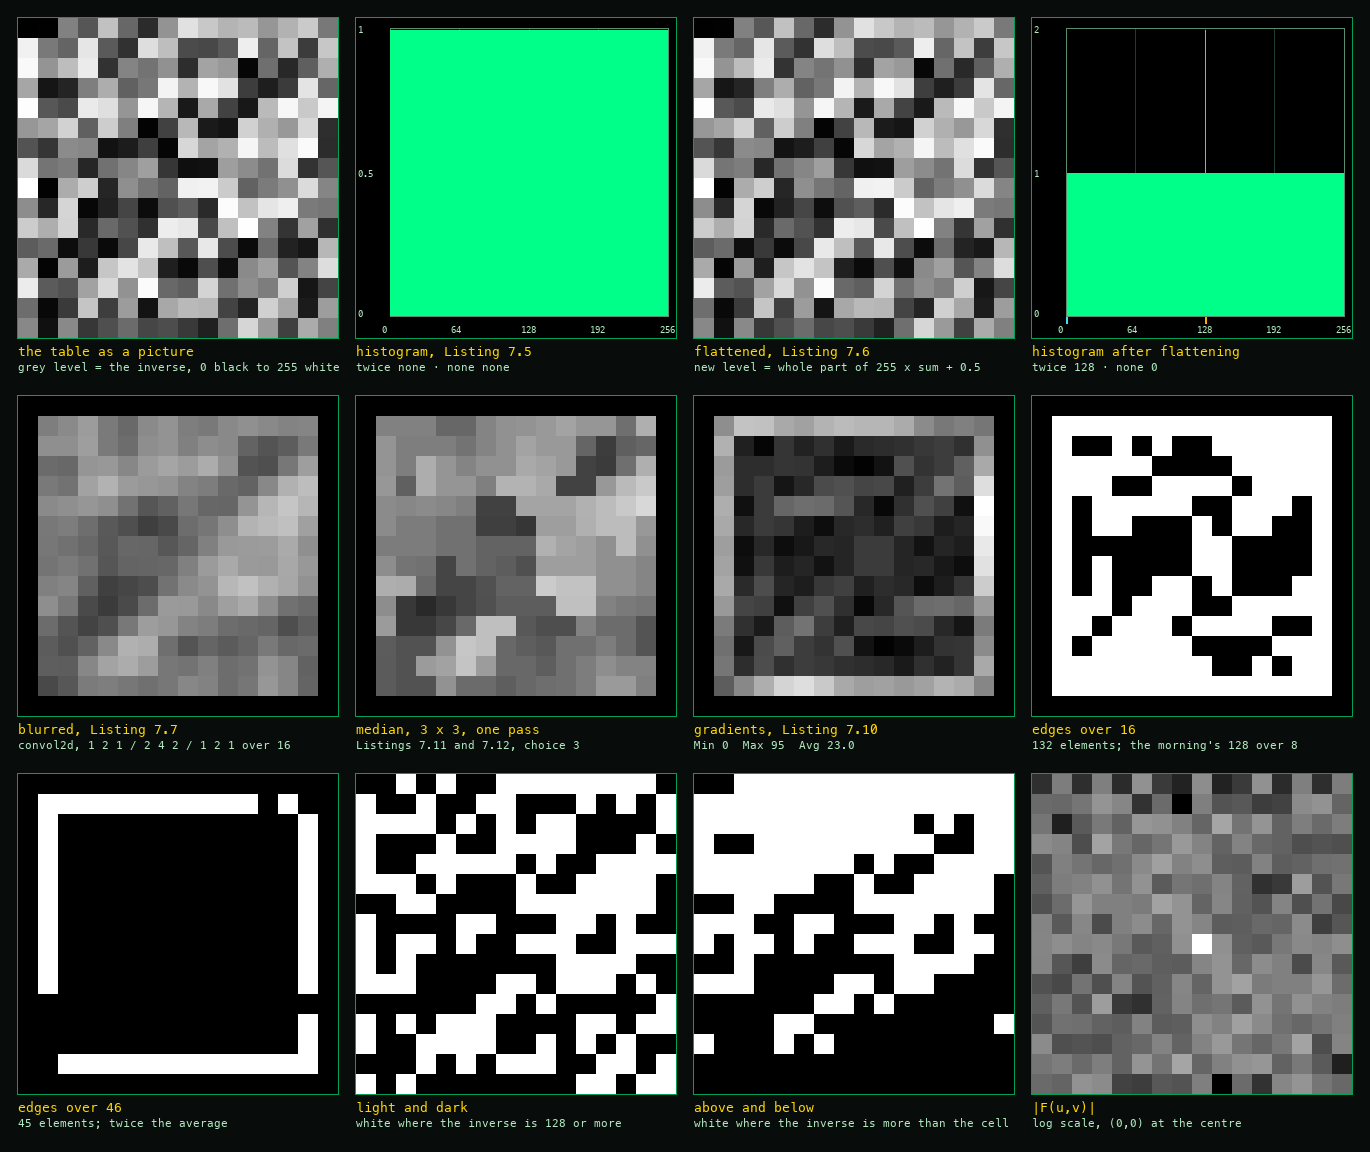
twelve panels: the pictures of section II
The twelve pictures of the inverse table, in the order of section II, held against the machine's own commands in the same way.
The plane, as printed
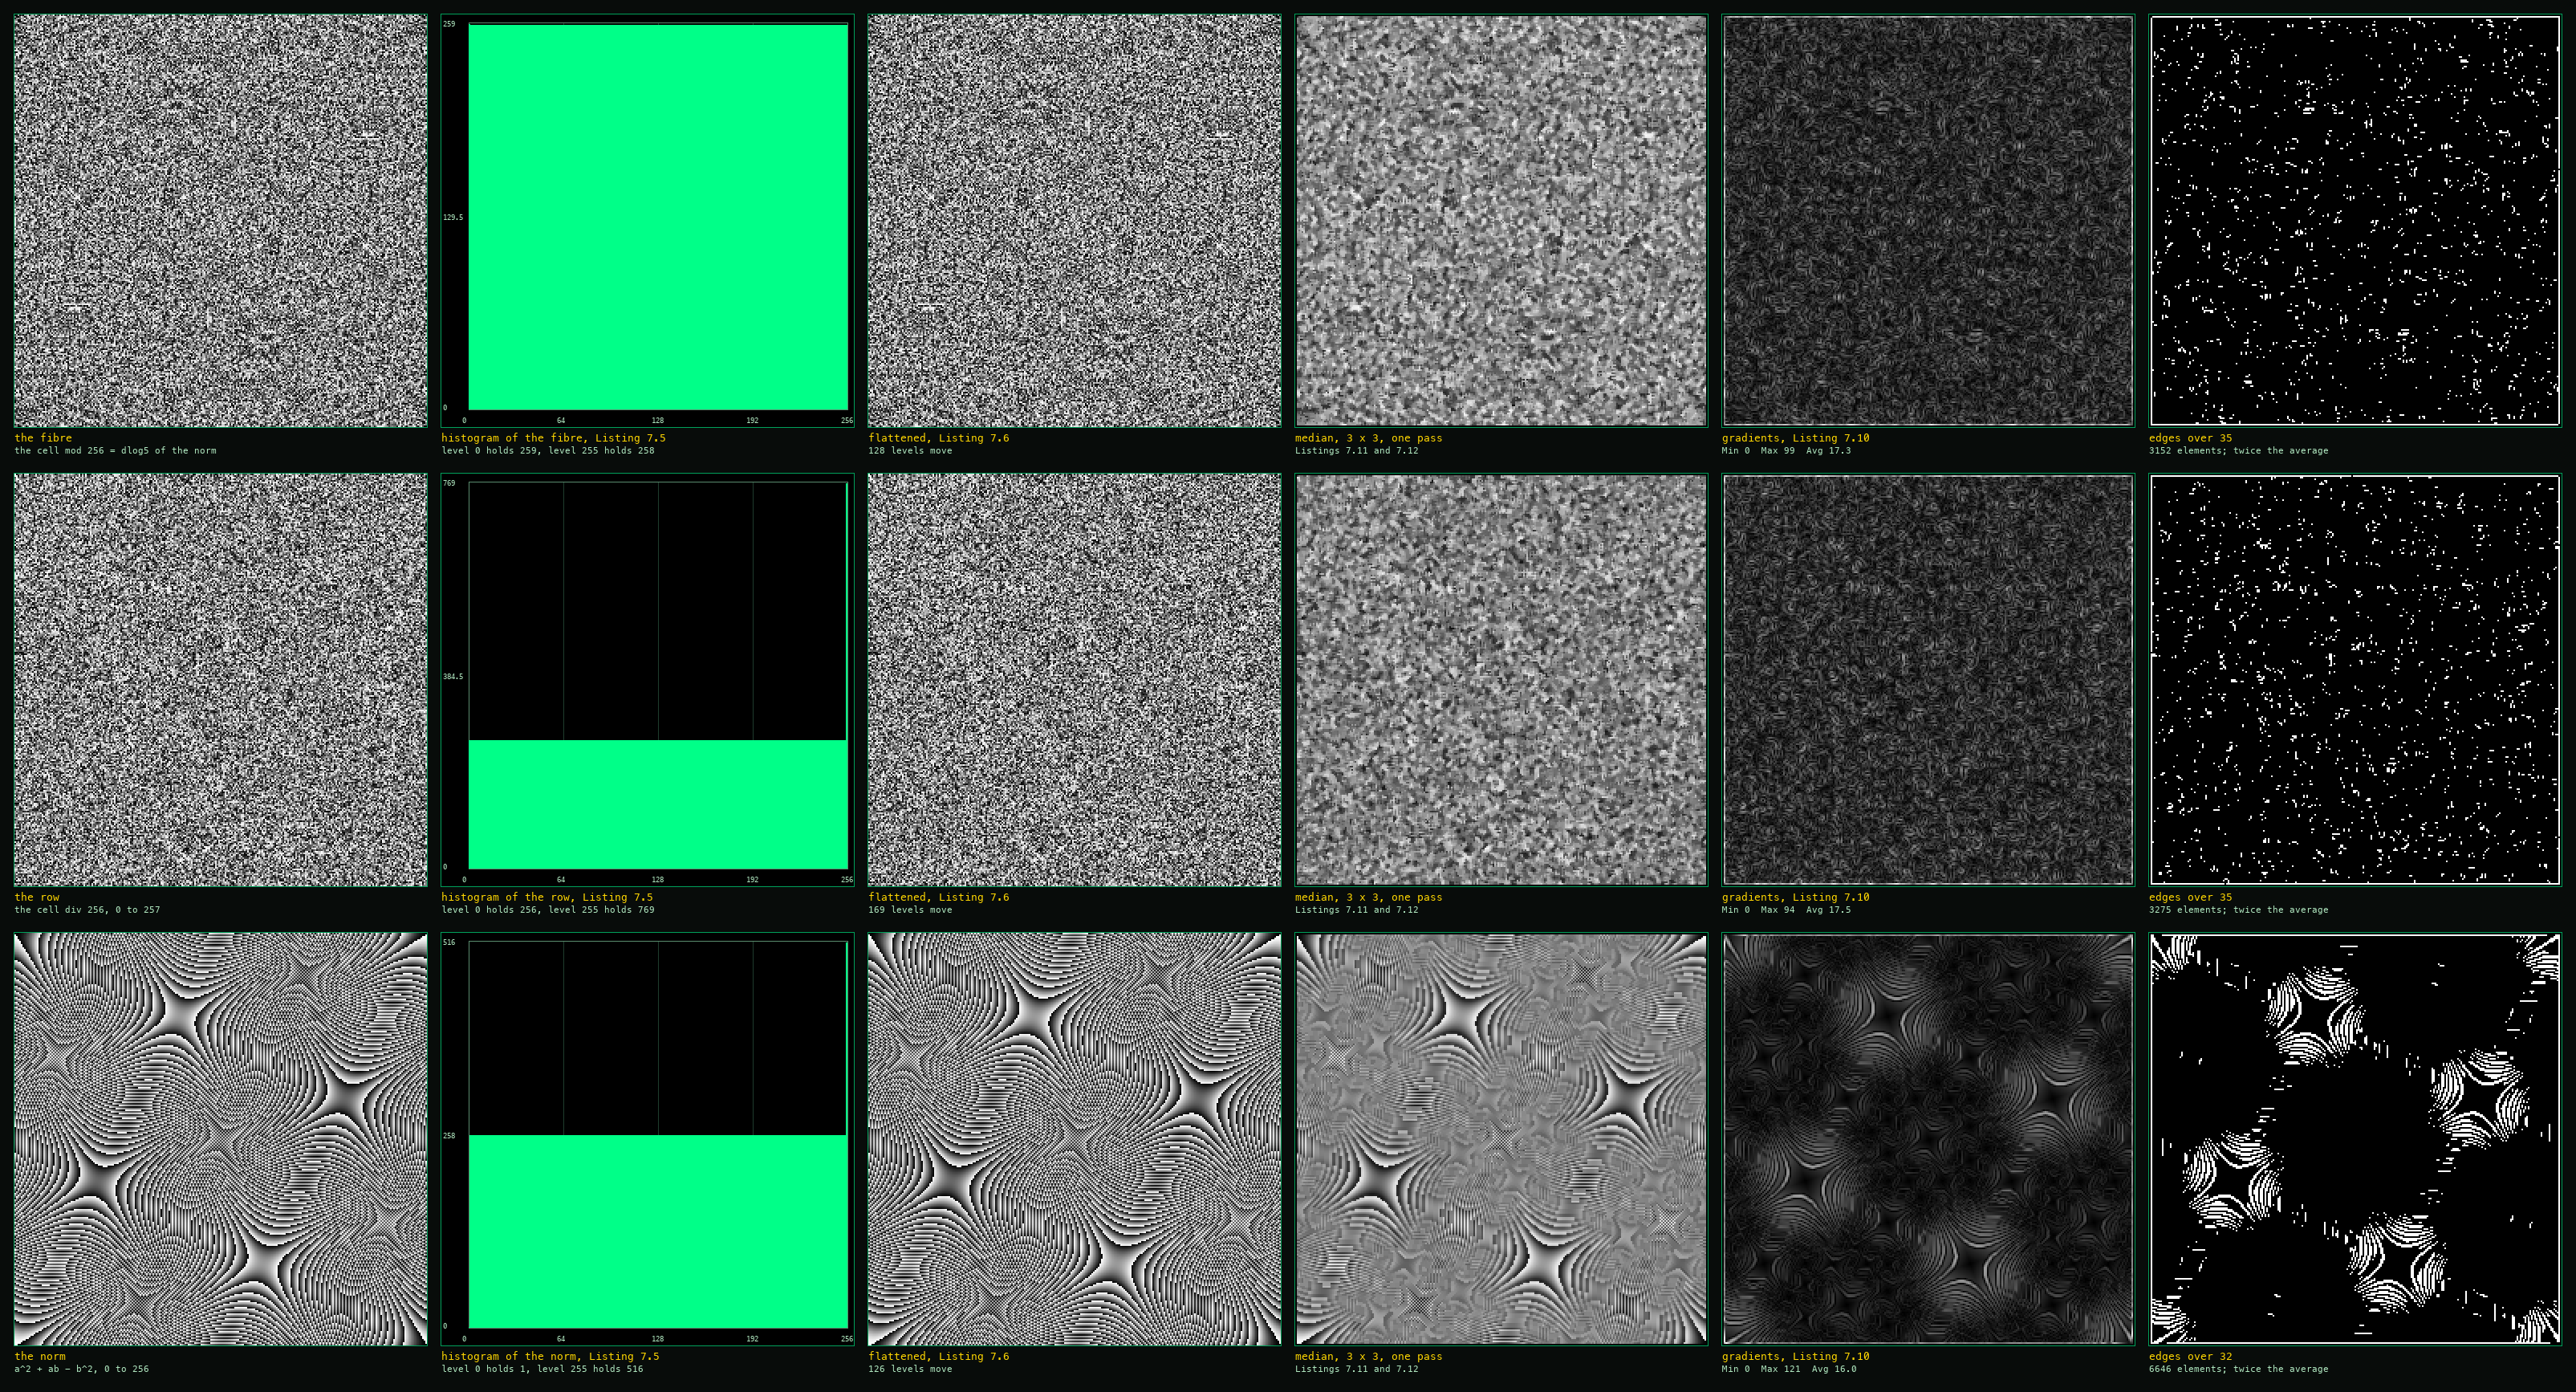
eighteen panels: the pictures of section III
The eighteen grey pictures of the plane: the fibre along the top, the row in the middle, the norm below, six panels to each. On the sheet the pictures are two screen points to an element; singly, above, they are three.
The plane in colour
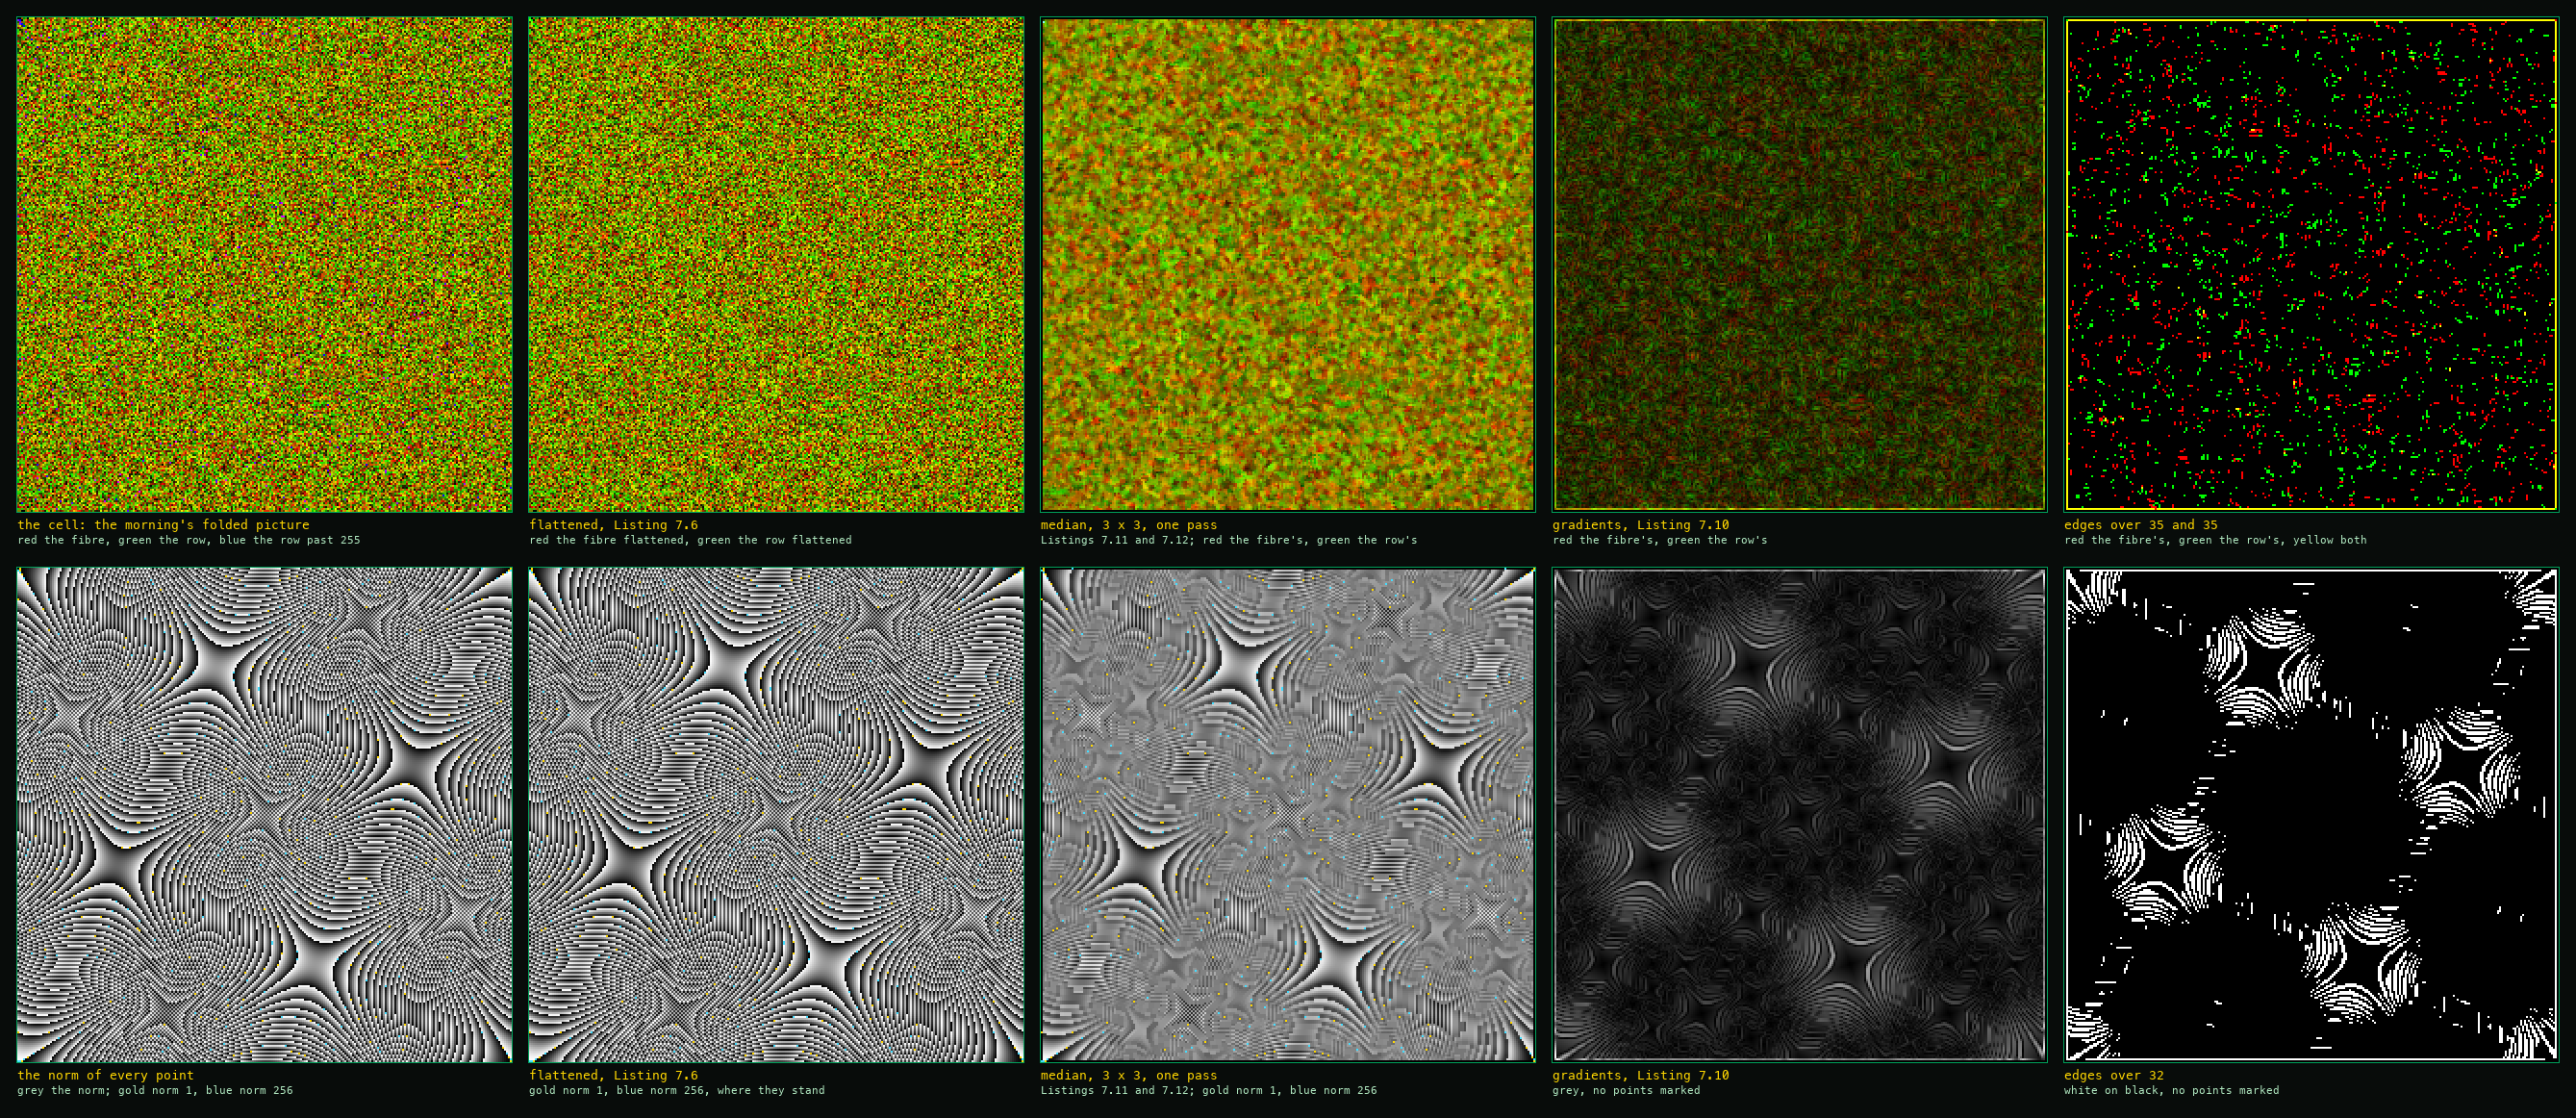
ten panels: the cell above, the norm below
The cell in colour along the top, five panels, and the norm below, its first three with the units marked and its gradients and edges as in the grey sheet.
The first sheet of the logarithms
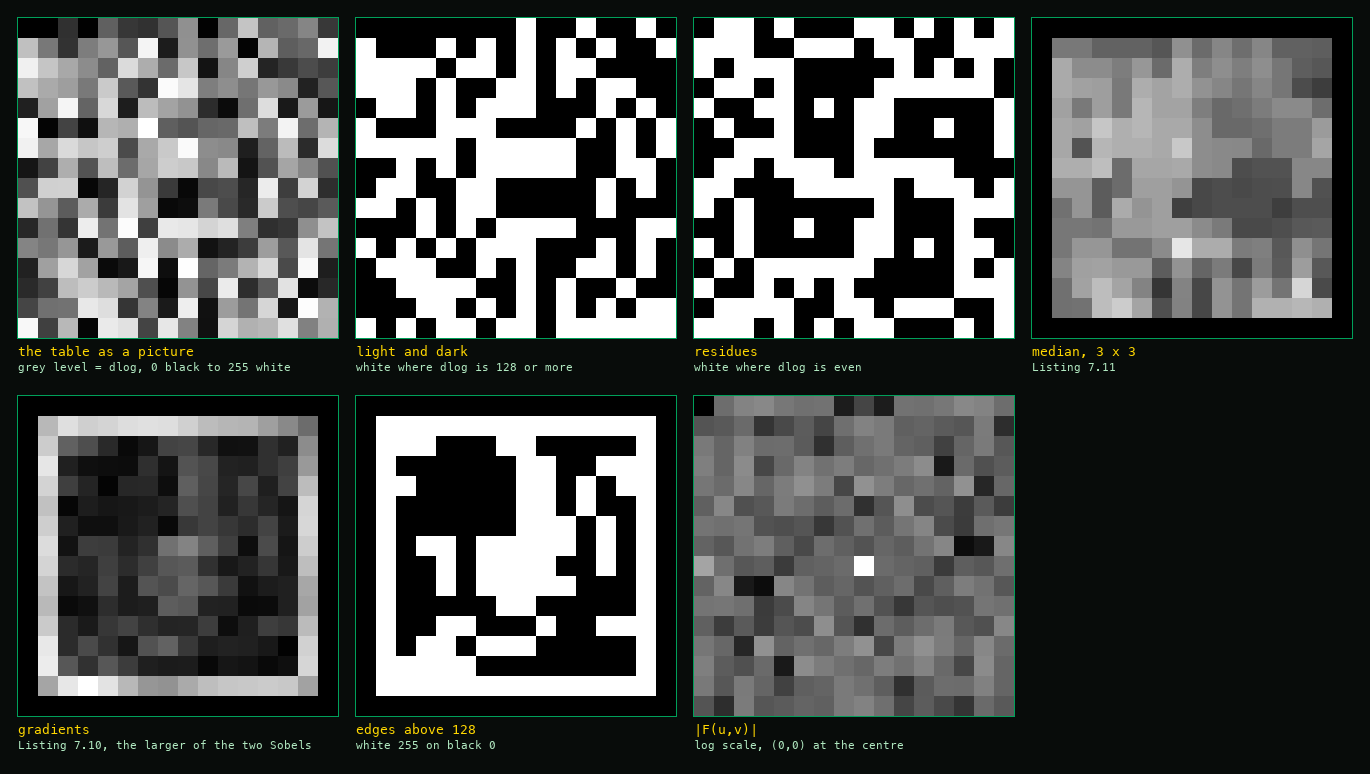
seven panels, the routines not yet as printed
The first sheet, seven panels: the table, light and dark, the residues, the median, the gradients, the edges above 128 and the transform. It was made before the listings were followed to the letter: its blur is rounded to the nearest whole number where the listing cuts toward 0, and its Sobel sums are not divided by 8. So its gradients run to 679 with an average of 172.6, and its edges above 128 are 108 elements. The elements over twice the average are the same on both sheets.
The first sheet of the inverses
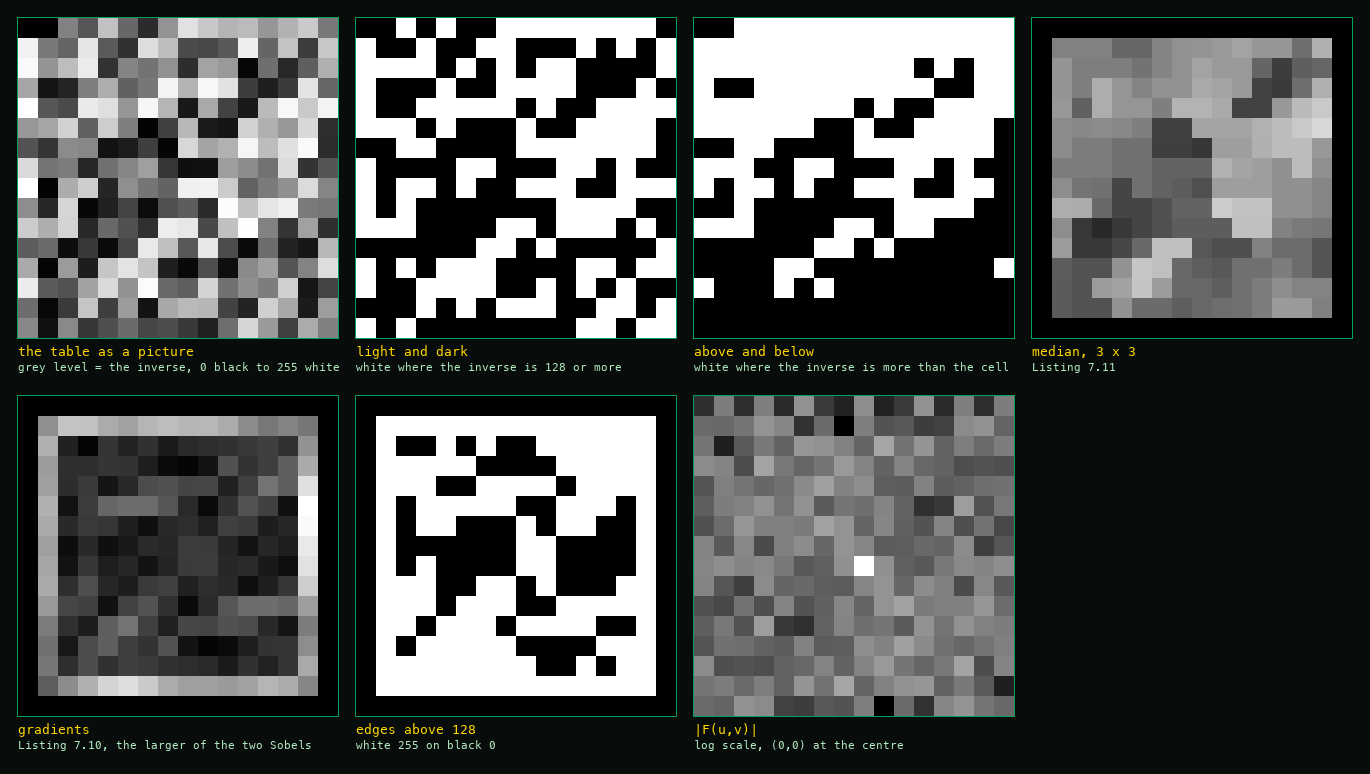
seven panels, the routines not yet as printed
The same for the inverses: gradients to 763, average 187.3, and 133 elements above 128.
The line folded and unfolded
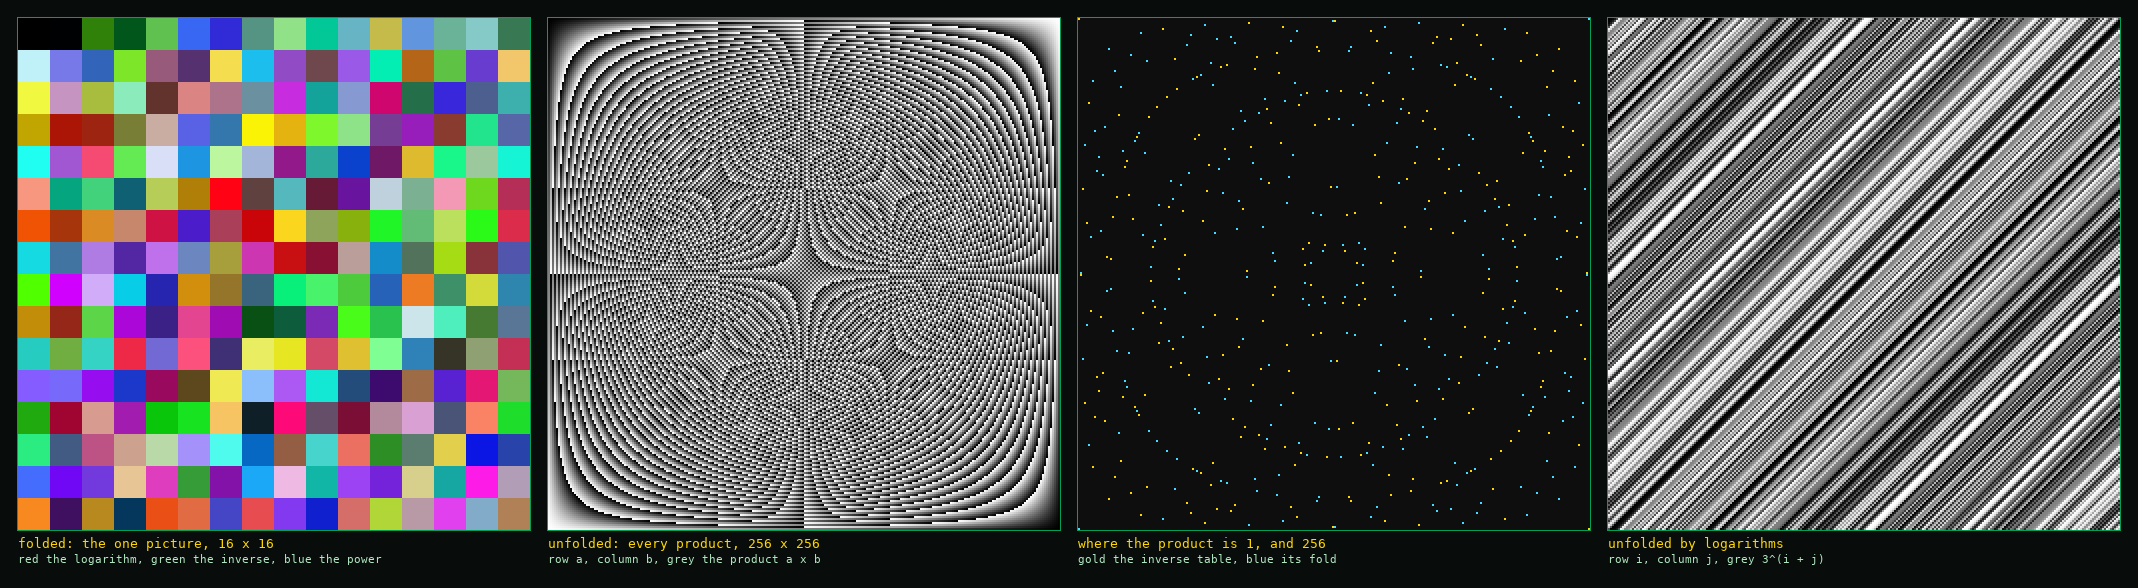
four panels: the first four pictures of section V
The four pictures of the line in section V as one sheet.
The plane folded and unfolded
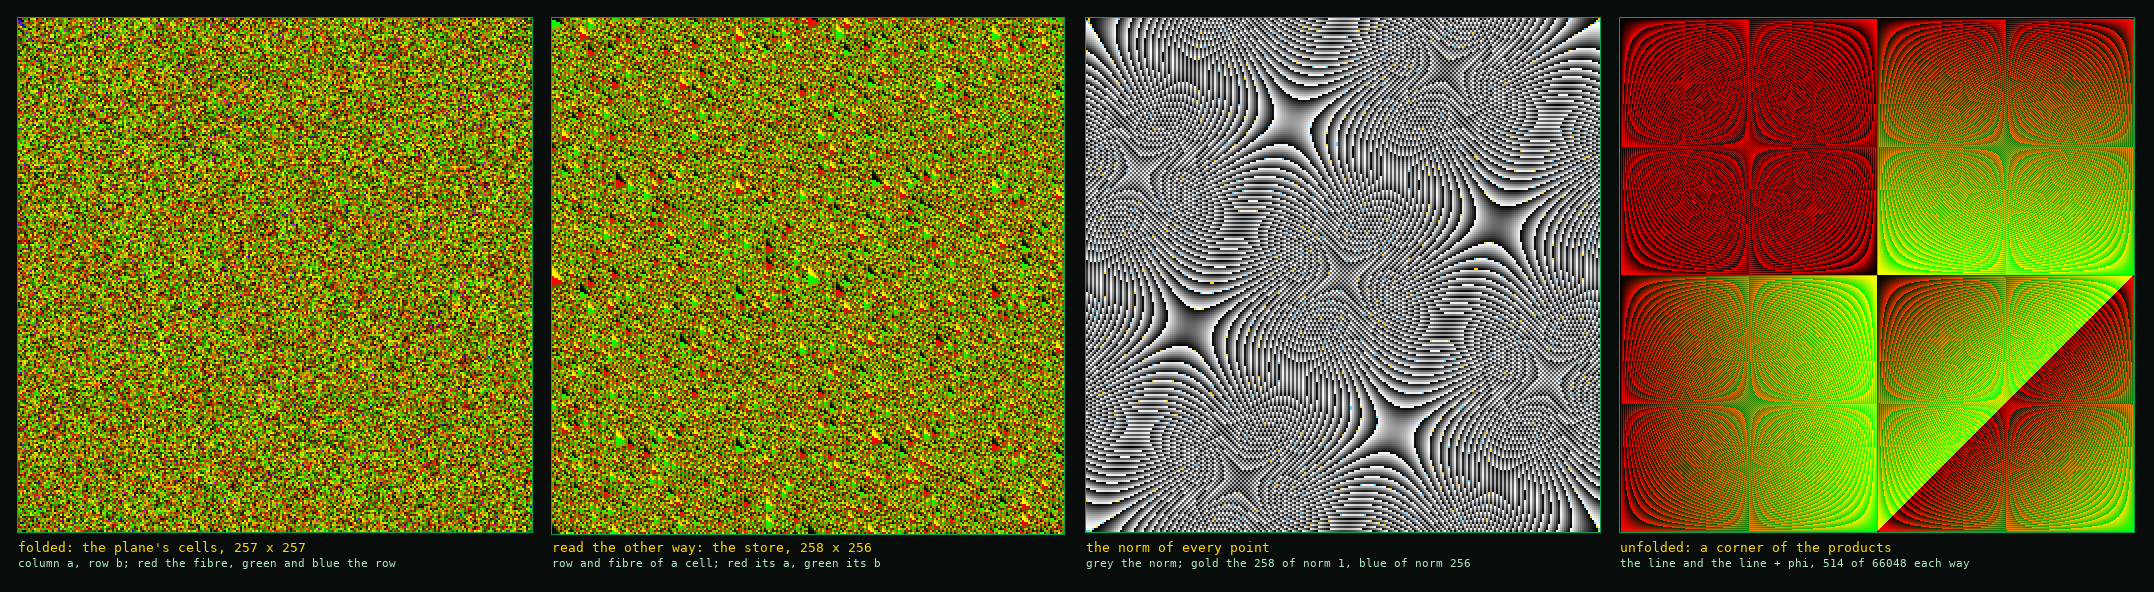
four panels: the cell in colour, the store, the norm with its units, a corner of the products
The plane's first sheet: the cell in colour, the store, the norm with the units in gold and blue, and the corner of the products. Its first and third panels are the first pictures of section IV.